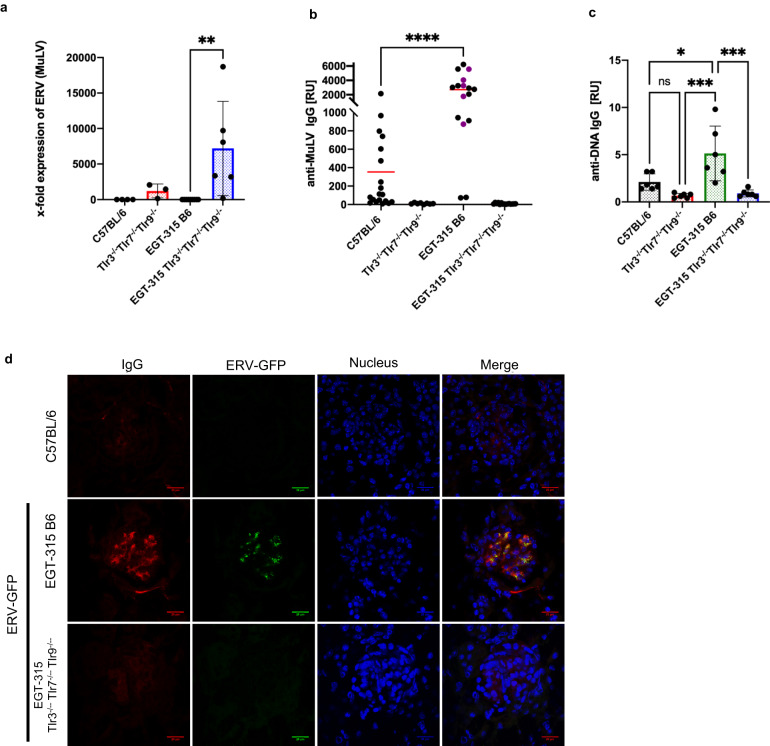
Fig. 6. ERV-GFP enhances natural ERV (MuLV of C57BL/6) expression, anti-MuLV antibody production, anti-DNA IgG production and immune complex deposition in kidneys.
a MuLV specific mRNA expression analyzed by Q-PCR of purified splenic B cells from individual mice. Actin was used to normalize expression. ERV (MuLV): C57BL/6 (black bar, mean = 0.04, SD = 0.03, n = 4), Tlr3−/−Tlr7−/−Tlr9−/− (red bar, mean = 1216, SD = 800, n = 4), EGT-315 B6 (green bar, mean = 0.89, SD = 0.23, n = 9), EGT-315 Tlr3−/−Tlr7−/−Tlr9−/− (blue bar, mean = 7202, SD = 6050, n = 6), Summary of 6 experiments; **P = 0.0055 by unpaired Two-tailed t test. b Anti-MuLV IgG production is increased in EGT-315 B6 mice. MuLV-specific ELISA of plasma from C57BL/6 (mean = 252.7, SD = 315.4, n = 19), Tlr3−/−Tlr7−/−Tlr9−/− (mean = 11.9, SD = 7.3, n = 8), EGT-315 B6 (mean = 2711, SD = 1936, n = 16 including 5 pools purple dots), EGT-315 Tlr3−/−Tlr7−/−Tlr9−/− (mean = 9.1, SD = 6.7, n = 15 including 5 pools), red lines depict mean value. Summary of 3 experiments; C57BL/6 vs EGT-315 B6 ****P < 0.0001. Statistics with Ordinary one-way ANOVA Tukey´s multiple comparisons test. c Anti-DNA IgG production is increased in EGT-315 B6 mice. DNA (ss and ds) specific ELISA of plasma from C57BL/6 (black bar, mean = 2.1, SD = 0.86, n = 6), Tlr3−/−Tlr7−/−Tlr9−/− (red bar, mean = 0.67, SD = 0.24, n = 6), EGT-315 B6 (green bar, mean = 5.1, SD = 2.9, n = 6), EGT-315 Tlr3−/−Tlr7−/−Tlr9−/− (blue bar, mean = 0.9, SD = 0.37, n = 6). **P = 0.0055. Statistics with Ordinary one-way ANOVA Tukey´s multiple comparisons test. d Confocal microphotography of immune complex deposition containing IgG and ERV-GFP in kidney glomeruli representative of EGT-315 B6 (n = 7) but not in C57BL/6 (n = 4) and EGT-315 Tlr3−/−Tlr7−/−Tlr9−/− mice (n = 2). Anti-IgG Alexa Fluor 633, DAPI (nucleus) and ERV-GFP are shown. Scale bar 20 µm. Source data are provided as a Source Data file.

