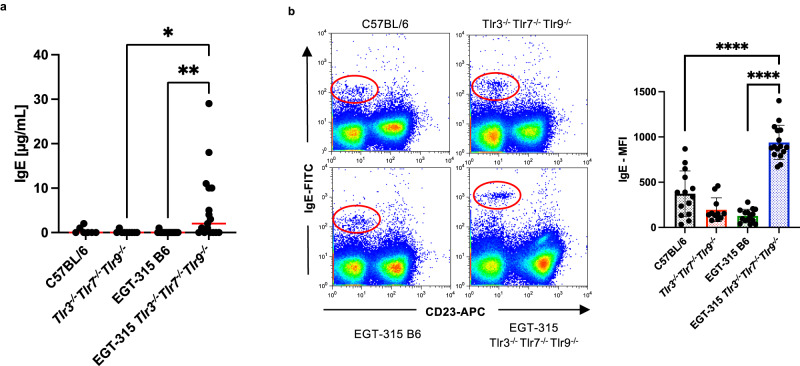
Fig. 7. Presence of ERV-GFP and absence of nucleic-acid Tlr-sensing results in systemic IgE overproduction.
a Serum IgE levels measured by IgE-specific ELISA from individual mice: C57BL/6 (mean = 0.43, SD = 0.79, n = 7), Tlr3−/−Tlr7−/−Tlr9−/−(mean = 0.11, SD = 0.33, n = 9), EGT-315 B6 (mean = 0.06, SD = 0.24, n = 18) EGT-315 Tlr3−/−Tlr7−/−Tlr9−/− (mean = 5.5, SD = 8.0, n = 17). Red lines depict mean value. Tlr3−/−Tlr7−/−Tlr9−/− vs EGT-315 Tlr3−/−Tlr7−/−Tlr9−/− *P = 0.035. EGT-315 B6 vs EGT-315 Tlr3−/−Tlr7−/−Tlr9−/− **P = 0.0061. Ordinary one-way ANOVA Tukey´s multiple comparisons test. Summary of 3 experiments. b Basophil-bound IgE levels measured by flow cytometry of spleen cells from individual mice: C57BL/6 (mean = 373, SD = 252; n = 14), Tlr3−/−Tlr7−/−Tlr9−/−(mean = 196, SD = 131, n = 11), EGT-315 B6 (mean = 128, SD = 73, n = 15), EGT-315 Tlr3−/−Tlr7−/−Tlr9−/− (mean = 939, SD = 190, n = 16). Left exemplary flow cytometry panel, and right panel statistical evaluation of MFI of the IgE+CD23- basophil population (red circle). C57BL/6 vs EGT-315 Tlr3−/−Tlr7−/−Tlr9−/− ****P < 0.0001. EGT-315 B6 vs EGT-315 Tlr3−/−Tlr7−/−Tlr9−/− ****P < 0.0001. Statistics with Ordinary one-way ANOVA Tukey´s multiple comparisons test. Summary of 12 experiments. Source data are provided as a Source Data file.

