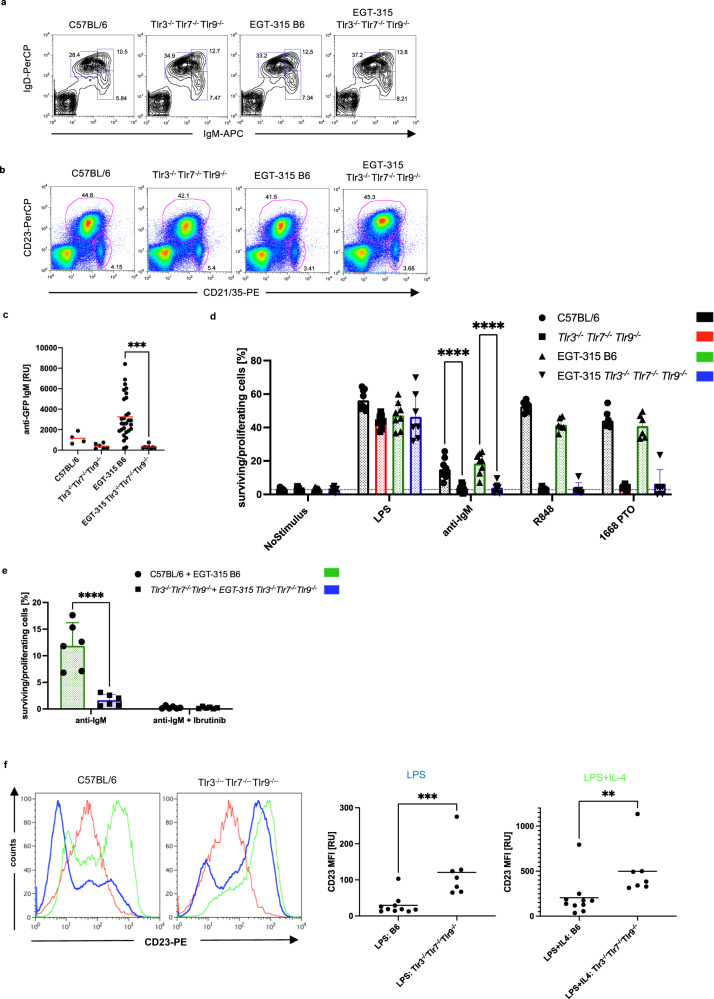
Fig. 8. Combined deficiency of Tlr3 Tlr7 Tlr9 in B cells impairs IgM-BCR induced B cell survival/proliferation but upregulates CD23 expression induced by Tlr4 in vitro.
a Flow cytometry plots of IgM vs IgD staining of splenic B cells representative of C57BL/6 (n = 7), Tlr3−/−Tlr7−/−Tlr9−/− (n = 7), EGT-315 B6 (n = 6), EGT-315 Tlr3−/−Tlr7−/−Tlr9−/− (n = 6). Squares: mature B cells (left), transitional B cells (right upper), immature B cells (right lower). Summary of 9 experiments. b Follicular (gate upper middle) and marginal zone (gate lower right) B cell distribution in Tlr deficient mice. Exemplary flowcytometry of spleen cells from C57BL/6 (n = 3), Tlr3−/−Tlr7−/−Tlr9−/− (n = 2), EGT-315 B6 (n = 6), EGT-315 Tlr3−/−Tlr7−/−Tlr9−/− (n = 5) using the B cell markers CD23 and CD21. Summary of 3 experiments. c GFP-specific IgM measured by GFP specific ELISA from individual mice: C57BL/6 (mean = 1160, SD = 476, n = 4), Tlr3−/−Tlr7−/−Tlr9−/− (mean = 392, SD = 229, n = 6), EGT-315 B6 (mean = 3249, SD = 2037, n = 29), EGT-315 Tlr3−/−Tlr7−/−Tlr9−/− (mean = 312, SD = 171, n = 8). Red lines depict mean value. EGT-315 B6 vs. EGT-315 Tlr3−/−Tlr7−/−Tlr9−/− ***P = 0.0004. Ordinary one-way ANOVA Tukey’s multiple comparisons test. d Survival/proliferation of purified B cells isolated from individual mice 72 h after in vitro stimulation (no stimulus, LPS = Tlr4 ligand, anti-IgM = BCR ligand, R848 = Tlr7 ligand, 1668 PTO = Tlr9 ligand) measured by flow cytometry using propidium iodide to distinguish live vs dead cells. C57BL/6 (black bar, for anti-IgM: mean = 15.1, SD = 5.9, n = 9), Tlr3−/−Tlr7−/−Tlr9−/− (red bar, for anti-IgM: mean = 3.2, SD = 2.0, n = 9), EGT-315 B6 (green bar, for anti-IgM: mean = 18.6, SD = 6.3, n = 8), EGT-315 Tlr3−/−Tlr7−/−Tlr9−/− (blue bar, for anti-IgM: mean = 4.0, SD = 3.0, n = 7). Summary of 12 experiments, 2 way ANOVA, Sidak´s multiple comparisons test ****P < 0.0001. e Role of Btk in survival/proliferation of purified B cells 72 h after in vitro stimulation. Anti-IgM was used with and without the addition of the Btk-inhibitor Ibrutinib. Cells from individual mice were tested. C57BL/6 and EGT-315 B6 combined (green bar, for anti-IgM: mean = 11.9, SD = 4.3, n = 6), Tlr3−/−Tlr7−/−Tlr9−/− and EGT-315 Tlr3−/−Tlr7−/−Tlr9−/− B6 combined (blue bar, for anti-IgM: mean = 1.7, SD = 1.1, n = 6). Summary of 5 experiments, 2-way ANOVA, Sidak´s multiple comparisons test, ****P < 0.0001. f Tlr3−/−Tlr7−/−Tlr9−/− B cells induced by LPS (Tlr4-ligand) upregulate CD23. Upper panels, LPS-mediated in vitro induction of CD23 is higher in Tlr3−/−Tlr7−/−Tlr9−/− B cells compared to wild type B cells. Flowcytometry examples of stimulated B cells from C57BL/6 and Tlr3−/−Tlr7−/−Tlr9−/− mice for 72 h with medium alone (red), LPS (10 μg/ml, blue) and LPS + IL-4 (LPS 10 μg/ml+ IL-4 250 U/ml, green). Right panels, Summary of MFI of CD23 from three independent experiments. Mann-Whitney test Two-tailed pairwise comparison ***P = 0.0007 and **P = 0.0031. B6 (n = 10), Tlr3−/−Tlr7−/−Tlr9−/− (n = 7). Source data are provided as a Source Data file.

