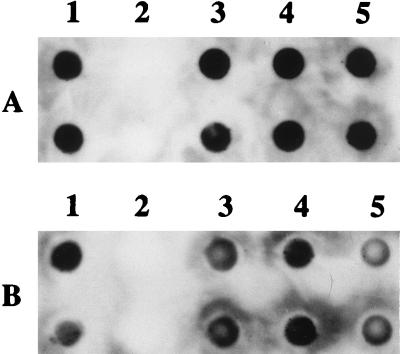
FIG. 5.
Dot blot analysis of human hemoglobin (A) and hemoglobin-haptoglobin complex (B) binding to H. influenzae HI689 (column 1), H. parainfluenzae 203 (column 2), H. influenzae HI689 hgpAΔBglII (column 3), H. influenzae HI689 hgpBΔBclI (column 4), and H. influenzae HI689 hgpAΔBglII/hgpBΔBclI (column 5). The rows in both panels represent 10-fold serial dilutions.

