
FIGURE 2.
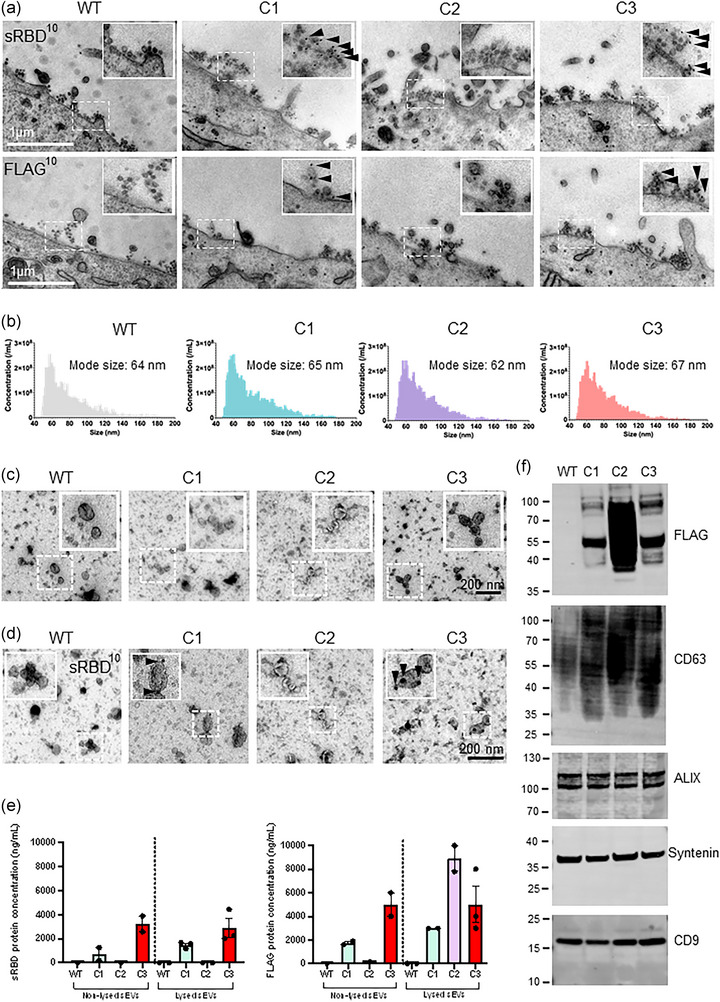
Characterisation of bioengineered sEVs. (a) Surface immunogold electron microscopy was performed on WT (mock), C1, C2 or C3 stable cells. Cells were treated with BafA1 (100 nM) for 16 h to induce sEV release. Samples were labelled with anti‐FLAG or anti‐sRBD antibodies, followed by 10 nm Protein‐A gold. Scale bar = 1 μm. Magnification (×1.5) shows the presence of labelled sEVs near the plasma membrane. (b) Size and concentration of sEVs isolated from WT, C1, C2 and C3 cell lines and analysed by NanoFCM. n = 3 independent experiments. (c) Transmission electron microscopy of isolated sEVs from WT (mock), C1, C2 or C3 cells. Scale bars = 200 nm. Insets are magnified 2×. (d) Immuno electron microscopy micrograph of isolated sEVs from WT, C1, C2, C3 cells labelled with an anti‐sRBD antibody. Arrowheads indicate gold labelling. Scale bar = 200 nm. (e) FLAG and sRBD enzyme‐linked immunosorbent assays (ELISA) was performed on non‐lysed and lysed stable cells. n = ≥2; mean ± SEM. (f) sEVs isolated from WT, C1, C2 and C3 stable cells were analysed by Western blot. FLAG staining was used to demonstrate the presence of engineered protein in sEVs. The sEV positive markers CD63, ALIX, Syntenin and CD9 were blotted. Representative images from three independent experiments.