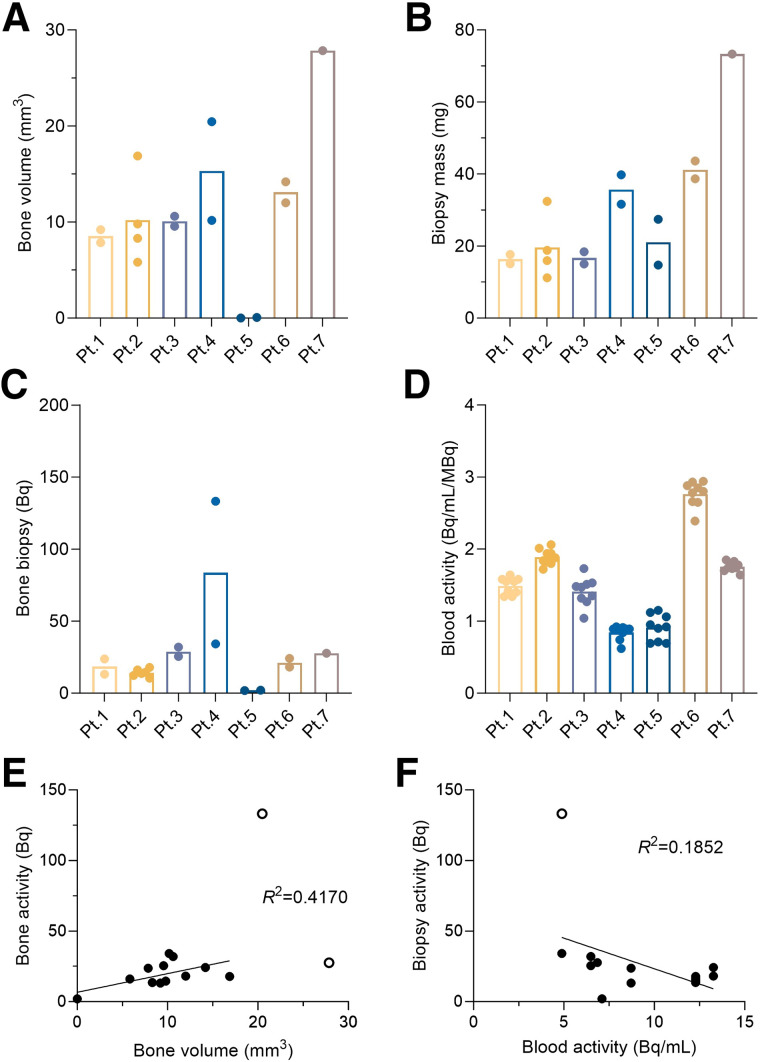
FIGURE 2.
(A and B) Bone volume from micro-CT scan (A) and mass of each biopsy specimen (B). Mass of biopsy specimens from patients 1 and 2 was estimated using bone and tissue volumes measured from micro-CT. (C) Activity of 223Ra in biopsy specimens for each patient. (D) Concentration of 223Ra in blood samples for each patient’s normalized to administered activity. (E and F) Correlation of biopsy activity and bone volume (E) and blood activity (F). Open circles in E and F are outliers removed from correlation. Pt. = patient.

