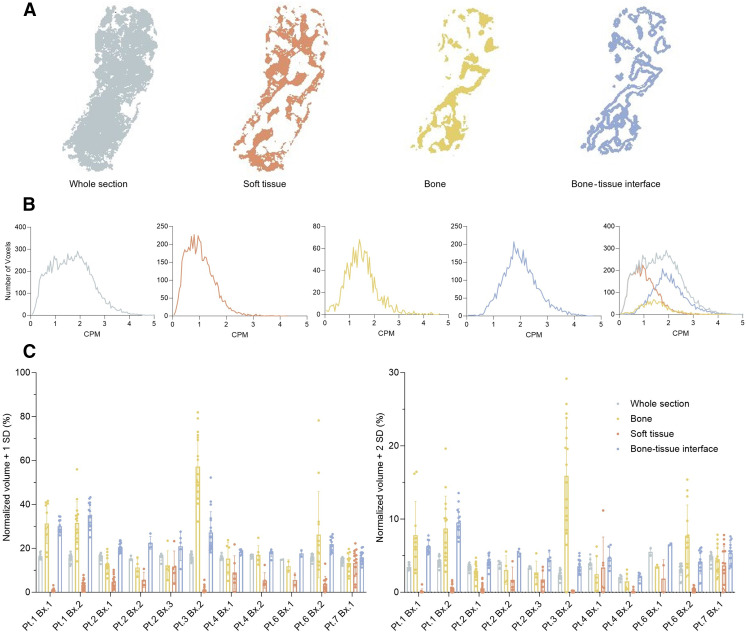
FIGURE 4.
(A) Representative compartments for analysis, using section 77 of patient (Pt.) 1, biopsy (Bx.) 1, for soft tissue, bone, and bone–tissue interface. (B) Histogram of CPM measured in each compartment for same section. (C) Volume of each compartment over mean + 1 or 2 SDs for each patient biopsy. CPM = counts per minute; STD = SD.

