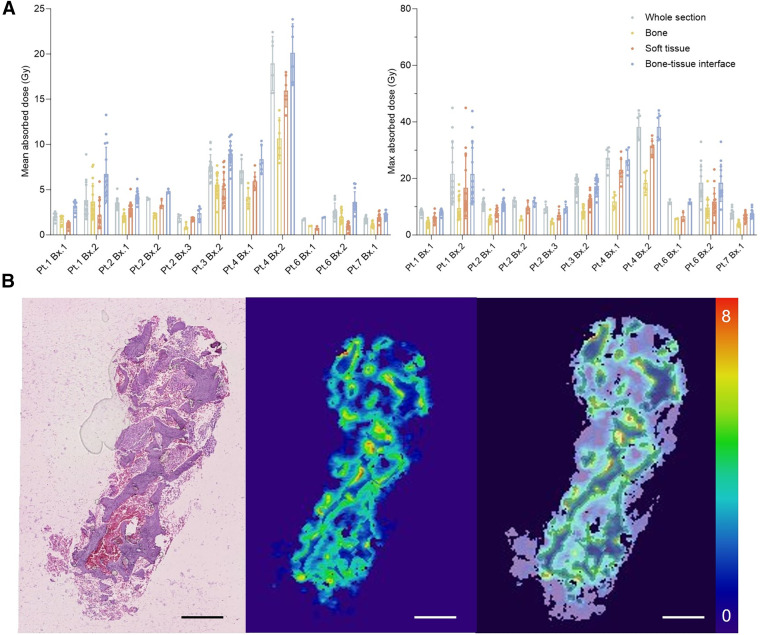
FIGURE 5.
(A) Mean and maximum absorbed dose to compartment from direct measures of 223Ra distribution by patient and biopsy section (n ≥ 8) at left and right, respectively. (B) Representative biopsy specimen from patient 1 including H&E staining, computed absorbed dose distribution, and fused dose to compartment model segmentation. Scale is in Gy. Pt. = patient; Bx. = biopsy.

