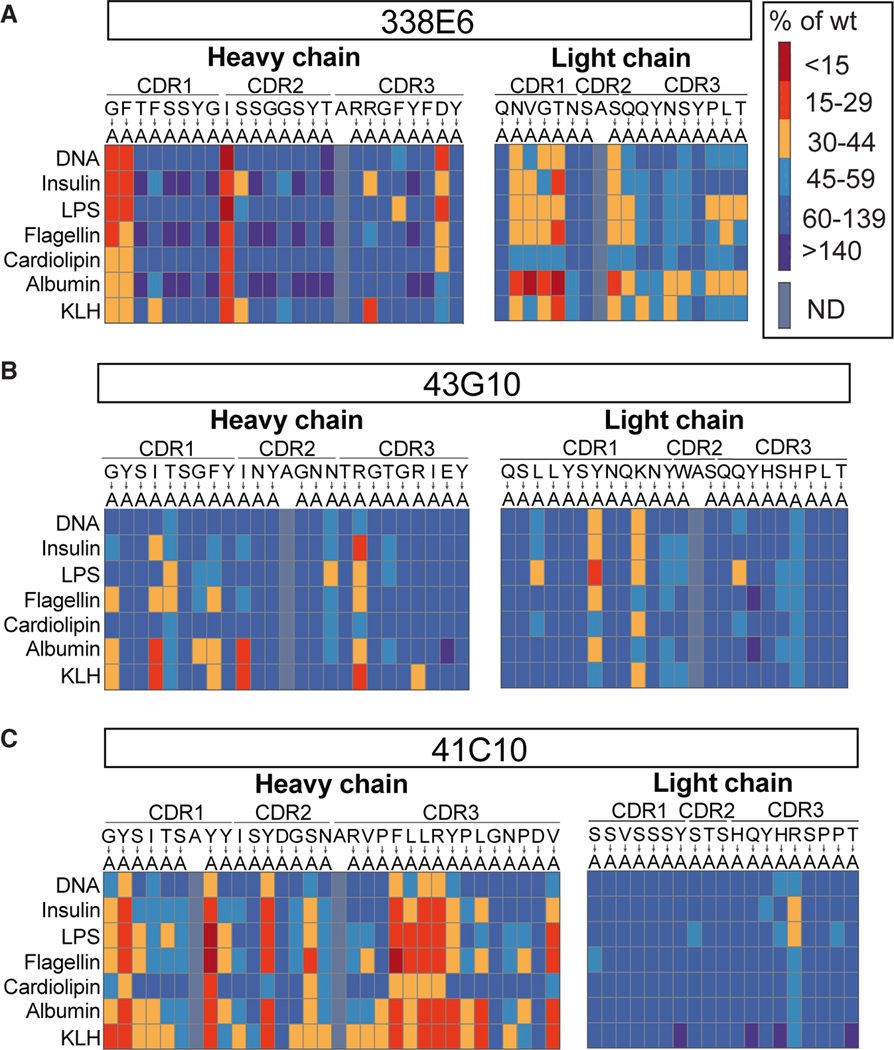
Figure 2. Alanine scanning of polyreactive mouse IgA mAbs and their reactivity to ligands.
(A–C) Summary plot of polyreactivity ELISA binding of three selected mouse IgA mAbs: (A) 338E6 mAb, (B) 43G10 mAb, and (C) 41C10 mAb, where selected residues of the CDR loops were mutated to alanine. All mutants were subjected to ELISAs against a panel of polyreactive antigens: DNA, insulin, LPS, flagellin, cardiolipin, albumin, and KLH. Native amino acids are shown on top, mutated to alanine (below). Results are color-coded based on a red (meaning more monoreactive) to blue (meaning more polyreactive) scale (A, on right), measured as percentage of wild-type mAb. Positions that were originally alanine were left unmutated.

