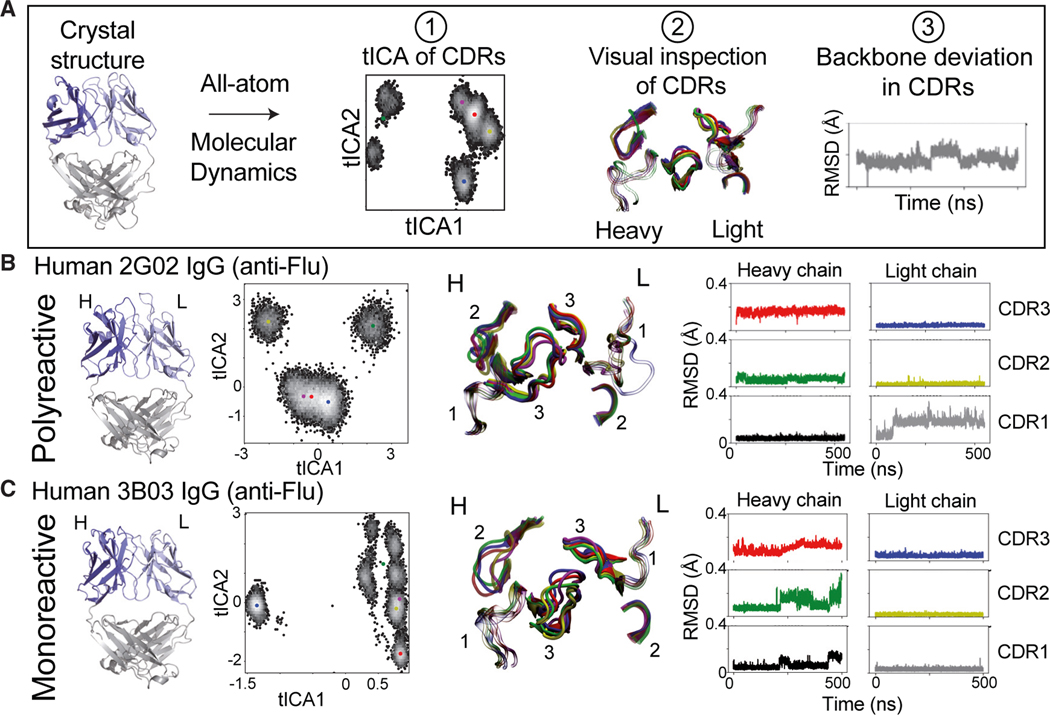
Figure 4. All-atom MD simulations and analysis on example human anti-flu polyreactive vs. monoreactive IgG.
(A) Workflow of all-atom MD analysis (500 ns), including clustering of CDR conformations via time-lagged independent component analysis (tICA) (1), visual inspection of CDR clusters (2), and RMSD (Å) of Cα backbone movements in CDR loops (3).
(B) From left to right: side view of the crystal structure of the polyreactive human 2G02 Fab shown in cartoon representations; tICA analysis based on 500 ns of all-atom MD simulations, where color dots represent the distinct cluster centers identified in tICA space using a K-means algorithm; representative CDR loop structures from the MD analysis, colored according to the cluster dot color in the tICA analysis; and RMSD (Å) of the Cα backbone movements across the 500-ns MD trajectory of each of the CDR loops.
(C) Same analysis as in (B) of the monoreactive human anti-flu 3B03 Fab structure.

