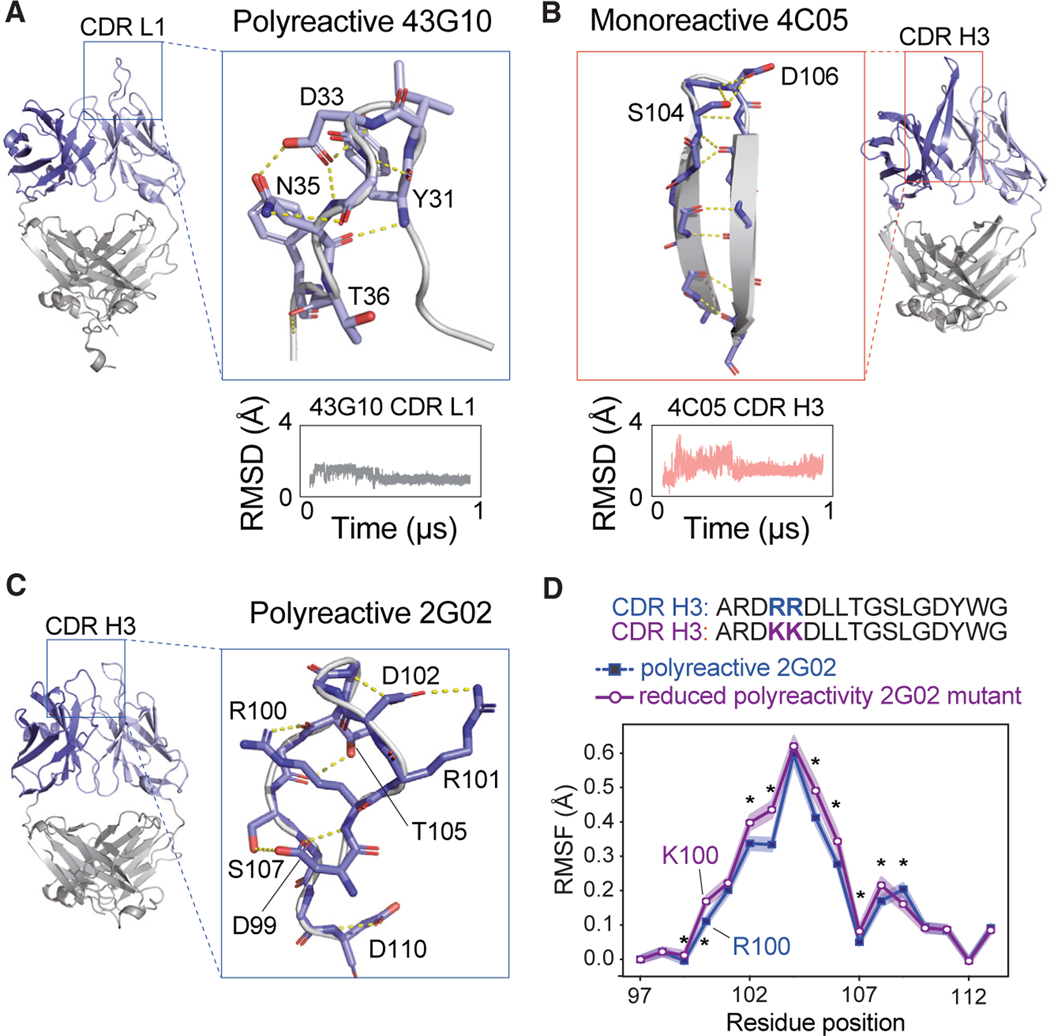
Figure 5. Examples of hydrogen bond network within CDR loops of polyreactive vs. monoreactive Fabs.
(A) Highlighted regions of the polyreactive 43G10 Fab structure showing the CDR1 loop of the light chain. This CDR loop maintains an extensive hydrogen bond network, shown as yellow dotted lines, mostly mediated by side chains throughout 1 μs of MD simulations. Red atoms indicate oxygens, and blue indicate nitrogens. Shown beneath the structure is the RMSD in Å of the Cα backbone movements across a 1-μs trajectory.
(B) Same analysis as in (A) but with the monoreactive 4C05 Fab structure, specifically highlighting the CDR H3 loop, which forms a β ribbon with the H-bond network (shown in dashed yellow) mostly mediated by backbone throughout 1 μs of MD simulations.
(C) Highlight of the polyreactive 2G02 CDR H3 loop, showing the mostly side-chain-mediated hydrogen-bonding network that maintains its structural stability and the two arginines at positions 100 and 101, which when mutated to lysines reduce polyreactivity.15
(D) Root-mean-square fluctuation (RMSF) of positions 97–113 of the wild-type (polyreactive, shown in blue) and RR/KK mutant (reduced polyreactivity, shown in purple) 2G02 H3 loop. The presented RMSF is a bootstrapped average over triplicate trajectories for each antibody, with the standard deviation given as shaded regions about this average. Asterisks identify statistically significant differences (p < 0.05) calculated using a non-parametric permutation test (STAR Methods).

