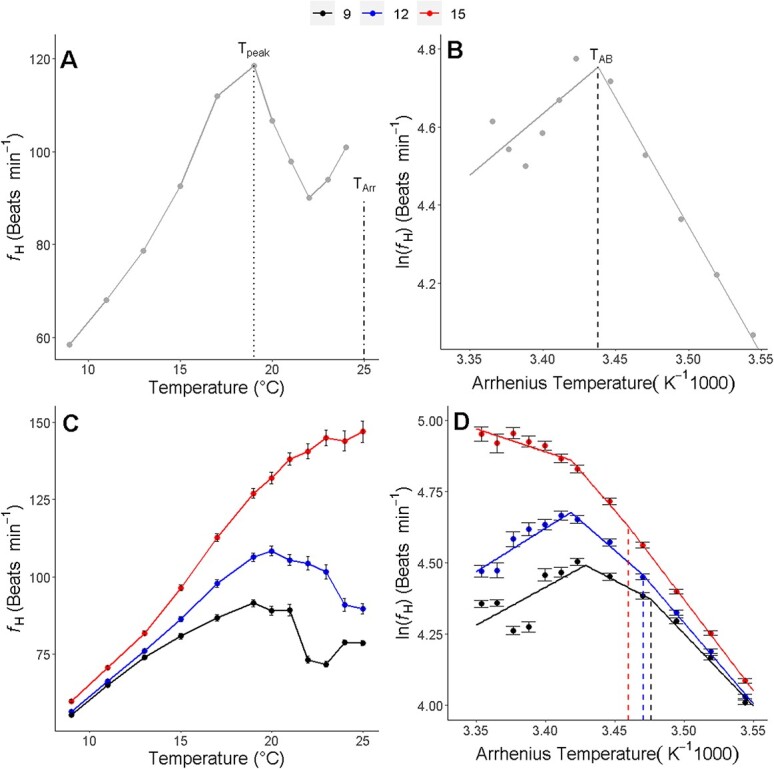
Figure 1.

The effect of increasing temperature on heart rate (fH) of longfin smelt larvae. Representative plot of heart rate with temperature (A) and Arrhenius plot of fH with increasing temperatures (B) for an individual larva. Average heart rate with temperature for all individuals (C) and Arrhenius plots of fH with increasing temperatures (D) for different incubation temperature groups. Regression lines for representative Arrhenius plots are divided into two segments, representing the method by which Arrhenius breakpoint temperatures (TAB) were determined for each individual. Unlike individual Arrhenius plots, grouped Arrhenius plots were best fit as 3 segments due to variation in post-TAB changes in fH across individuals. Dotted line indicates temperature where heart rate peaks (Tpeak), dash-dotted line indicates temperature where cardiac arrhythmia was first observed (TArr), and dashed line indicates the TAB. Data presented as mean ± SEM.
