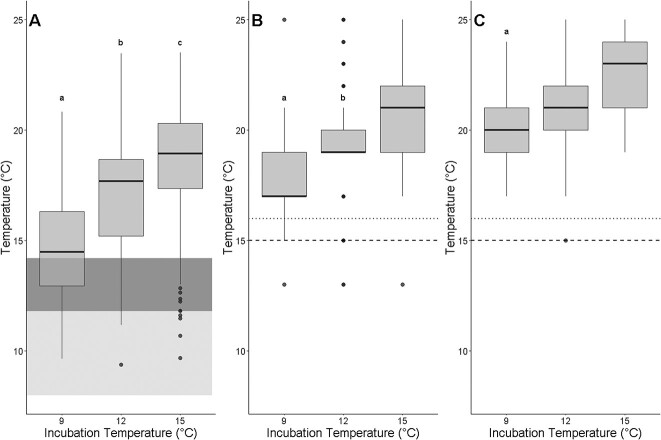
Figure 2.
Median cardiac metrics do not correlate with inferred optimal temperatures or upper thermal limits. Arrhenius breakpoint temperature (TAB) (A), temperature where heart rate reaches a maximum (Tpeak) (B), and temperature where arrhythmia first occurs (TArr) (C) of one day post-hatch longfin smelt larvae incubated at and held for one day at different temperatures. Boxplots represent median, first and third quartiles of cardiac performance metrics. Shaded dark gray area indicates the temperature range in which longfin smelt are cultured at the Fish Conservation and Culture Laboratory (Supplementary Table 3) and light gray shaded area indicates the temperatures where longfin smelt larvae are most abundant in the San Francisco Estuary. Dotted lines indicate the temperature beyond which longfin smelt larvae are no longer observed in the field and dashed lines indicate the temperature where reduced larval growth rates have been measured. Different letters indicate statistical significance between incubation temperatures within each cardiac performance metric.

