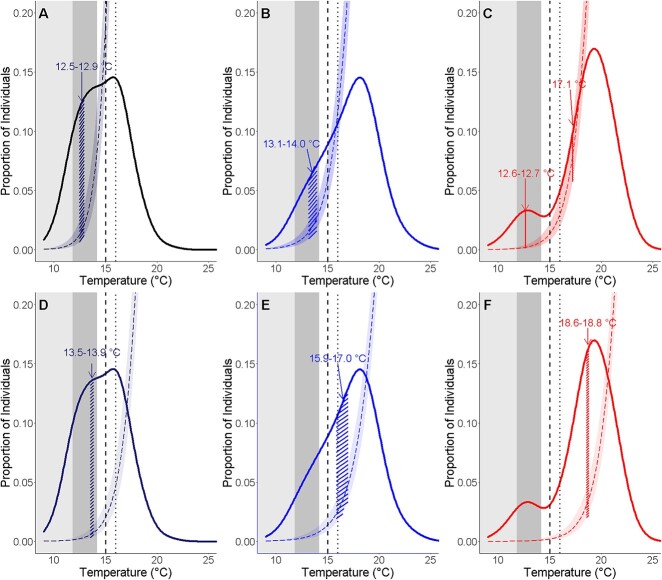
Figure 4.
Overlays of proportion of individuals at Arrhenius breakpoint temperatures (TAB) and temperatures where heart rate is maximized (Tpeak) and experience arrhythmia (TArr) reveal a temperature range where the proportion of individuals at TAB relative to Tpeak or TArr is maximized. Overlay of the proportion of individuals at TAB and that have reached Tpeak (A-C) and TArr (D-F) for 9°C (A,D), 12°C (B,E), and 15°C (C,F) incubation temperature groups. Smooths of proportion of individuals at TAB are kernel density estimates of proportion of individuals at TAB. Dashed and dotted curves are logistic curves of the proportion of individuals at Tpeak and TArr. Logistic curves are the same as in Fig. 3. Hashed areas under curve indicate the temperature ranges where TAB-Tpeak and TAB-TArr are maximized. Dark gray shaded area indicates temperature range that longfin smelt larvae are cultured at the Fish Conservation and Culture Laboratory (Supplementary Table 3), and light gray shaded areas indicate temperatures where larvae are most abundant in the San Francisco Estuary. Dotted lines indicate the temperature beyond which longfin smelt larvae are no longer observed in the field and dashed lines indicate the temperature where reduced larval growth rates have been measured.

