
Figure 7.
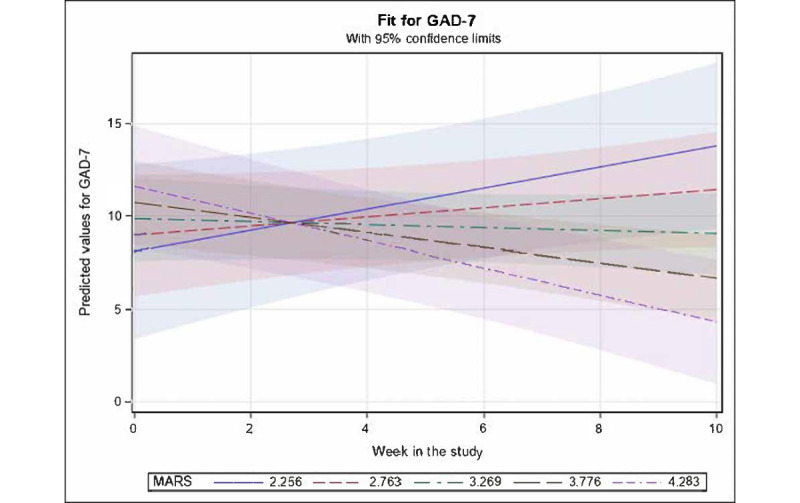
Mean values for Generalized Anxiety Disorder Scale-7 (GAD-7; with 95% CI) predicted by significant fixed effects in the fitted longitudinal model of GAD-7 versus week in study, Mobile Application Rating Scale (MARS), Player Experience of Needs Satisfaction Scale, and treatment initiation. For fixed effects, only an interaction of MARS × linear week in study was retained as significant (P=.002), whereby GAD-7 values were predicted by the model to vary from rising linearly across time among individuals with relatively lower MARS ratings to declining linearly across time for those with relatively higher MARS ratings. Selected illustrative strata of MARS in the figure were chosen to range from the minimum observed value of 2.256 up to the maximum observed value of 4.283 and at equally spaced intervals in between. The slight crossover of lines before approximately week 3 is likely just an artifact of the linear constraint for the lines and probably should not be interpreted with substantive meaning.