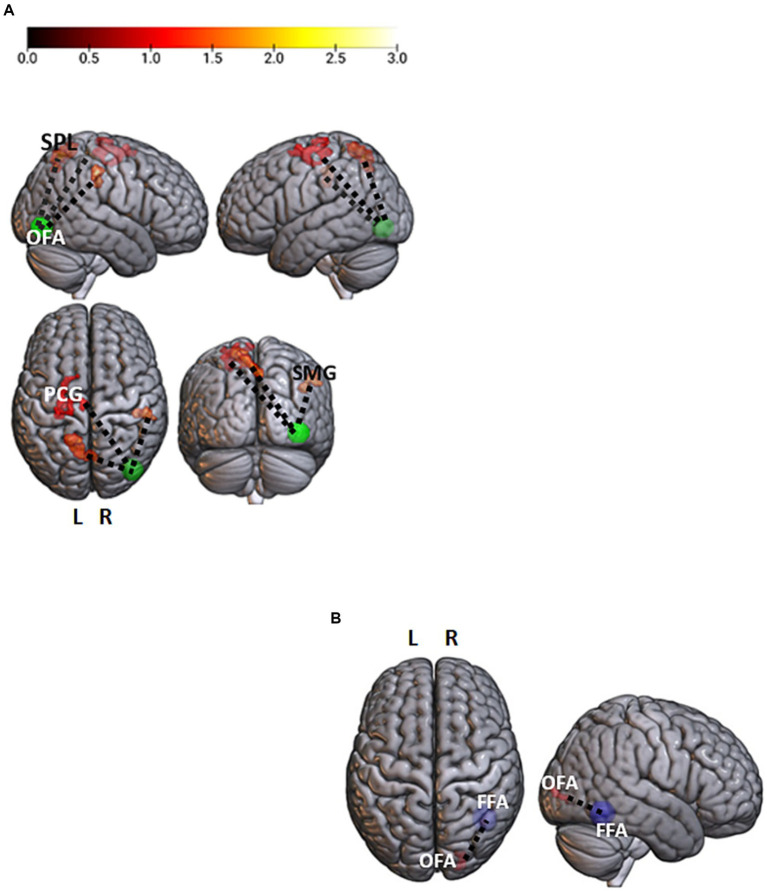
Figure 2.
Facial emotions and neutral contrasts analyses. (A) Brain regions showing a significant stronger association with the right occipital face area (rOFA, p-uncorrected <0.001 voxel level and p-FWE < 0.05 cluster level) for the masked > unmasked contrast. The rOFA is represented at MNI coordinates x = 39, y = −79, z = −6, 10 mm diameter. Color bar represents t-values. (B) A significant stronger correlation between the right fusiform face area (rFFA; x = 40, y = −55, z = −12) and the homolateral OFA (rOFA; x = 39, y = −79, z = −6) for the neutral unmasked > neutral masked contrast (p-uncorrected <0.001 voxel level and p-FWE < 0.05 cluster level). OFA, Occipital Face Area; FFA, Fusiform Face Area; PCG, PreCentral Gyrus; SPL, Superior Parietal Lobe; SMG, Supramarginal Gyrus; L, Left; R, Right.

