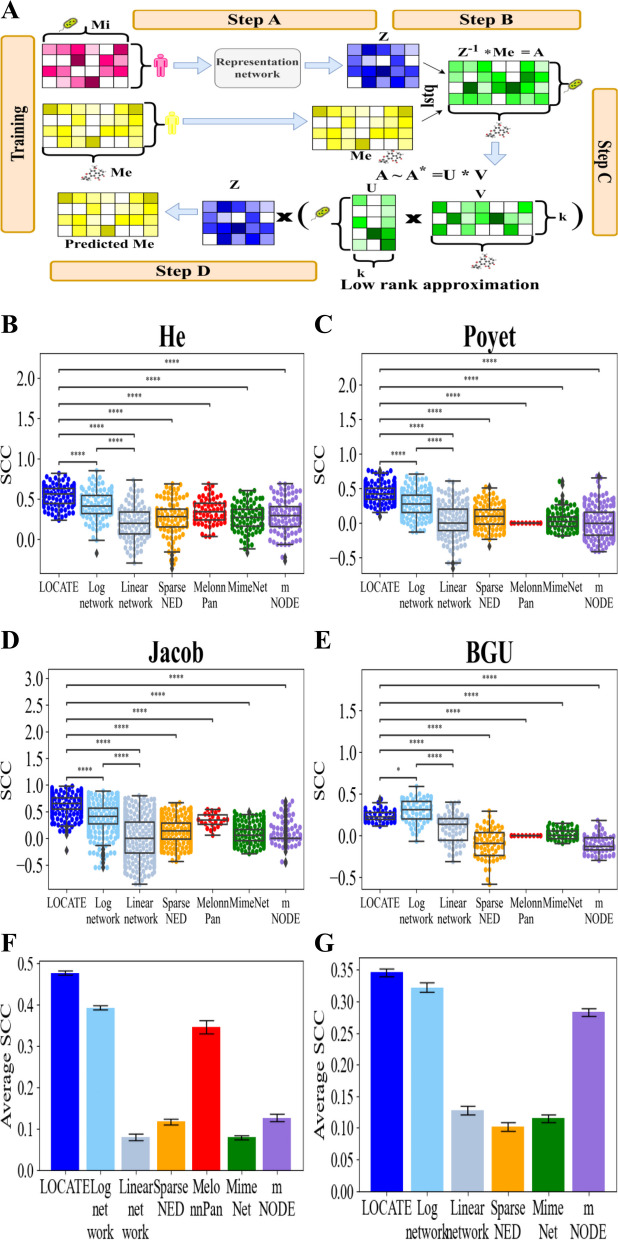
Fig. 3.
LOCATE can be used to predict metabolites in each dataset separately better than all existing methods. A A schematic figure of LOCATE’s training. Pairs of the preprocessed microbiome (Mi, in pink) and metabolites data (Me, in yellow) are the input of LOCATE. The preprocessed microbiome data is projected to a representation (Z) with a lower dimension than the microbiome using a fully connected neural network (step A). Then, Z is used to predict the metabolites of the training set. LOCATE finds a microbiome-metabolites relations matrix A, such that (step B). A is then passed through an SVD with low-rank approximation to prevent an overfit (, step C) and then is multiplied by Z to get the predicted metabolites (step D). This entire process is trained at once. B–E Comparison between LOCATE and all state-of-the-art metabolites prediction models over the different 16S datasets He (B), Poyet (C), Jacob (D), and Direct Plus (E) for the swarm plots on the rest datasets (Supplementary material Fig. S1). Each point represents the SCC of a single metabolite in the dataset. In MelonnPan, there are fewer points since it predicts only the “well-predicted” metabolites as defined in the original paper [57]. Furthermore, when all the SCCs are 0, the model fails in the prediction of this dataset. A two-sided t-test was applied between the SCCs of the different models. LOCATE is significantly better with . The stars represent the p-values, such that *, **, ***, ****. F–G Average SCCs over all metabolites and all the datasets per model, the 16S averages (F) and the WGS averages (G). The black error bars represent the standard errors over all metabolites and all the datasets

