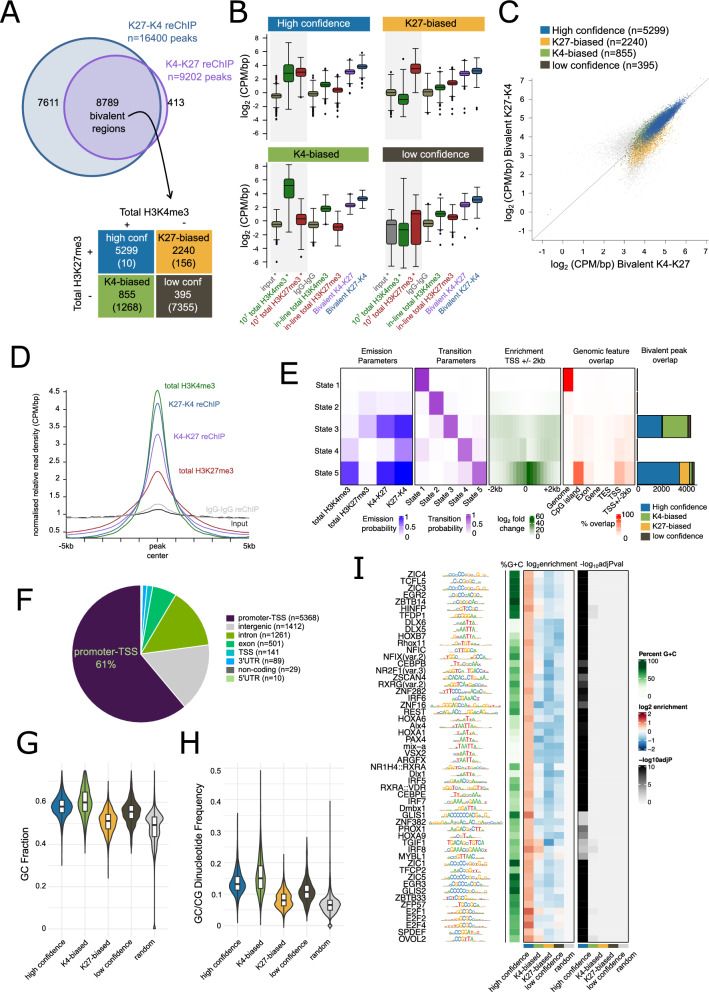
Fig. 3.
Identification of 8,789 bivalent regions in mouse embryonic stem cells. A Overlap between K27-K4 (blue) and K4-K27 (purple) reChIP datasets. The 8,789 overlapping peaks were classified as high confidence (overlap peak in both total H3K4me3 and total H3K27me3, blue), K4-biased (overlap peak in only total H3K4me3, green), K27-biased (overlap peak in only H3K27me3, orange) or low confidence (does not overlap peak in either H3K4me3 or H3K27me3, brown) using independent total H3K4me3 and H3K27me3 single ChIPs from approximately 10 million cells from GSE135841 [7]. B Box-whisker plots (line shows median and box denotes 25th and 75th percentile, whiskers shown interquartile range multiplied by 2) showing log2CPM/bp values for high confidence (top left), K4-biased (top right), K27-biased (bottom left) and low confidence (bottom right) peaks in independent total H3K4me3 and total H3K27me3 datasets from GSE135841 [7] (denoted by * and shaded grey background) or the in-line total and reChIP datasets generated in this study. C Scatter plot showing log2CPM/bp values for bivalent K4-K27 (x-axis) and bivalent K27-K4 (y-axis) datasets for all bivalent peaks highlighting high confidence (blue), K4-biased (green), K27-biased (orange) and low confidence (brown) peaks. D Relative distribution plot (each probe is weighted equally in final profile) of reads across peaks showing broader peak width for H3K27me3 peaks compared to H3K4me3 and reChIP peaks E 5-state chromHMM models using pooled replicates for in-line total H3K4me3, in-line total H3K27me3 and K4-K27 and K27-K4 reChIP datasets showing emission (left) and transmission (second from left) parameters, enrichment across TSS ± 2kb and overlap with high confidence (blue), K4-biased (green), K27-biased (orange) and low-confidence (brown) bivalent regions (right). F Genomic features associated with the bivalent regions. G, H Violin plots showing GC fraction G and GC-CG dinucleotide frequency H within regions compared to random subset (width and GC-content matched) of 8,789 genomic regions. All comparisons are statistically significant after multiple testing (Benjamini–Hochberg correction). I Motif enrichment for the four classes of bivalent peaks compared to the same background set used in G, H. Those with log2enrichment over random sequences > 1 are shown, along with their enrichment scores and -log10Adjusted p-value

