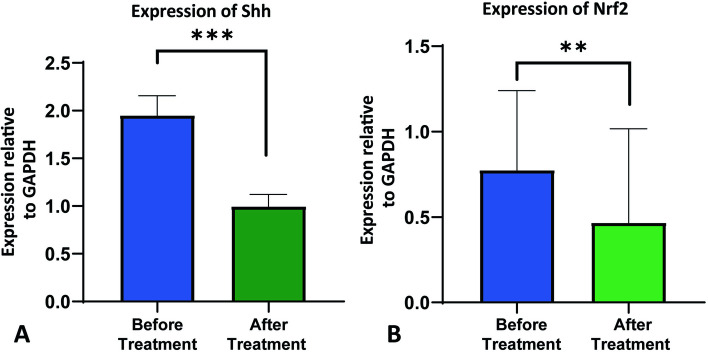
Fig. 7.
Expression of Shh and Nrf2 before and after chemo and/or radiotherapy (A) Quantitative real-time (qRT-PCR) was used to measure Shh expression in study participants’ blood samples before and after treatment, normalized against GAPDH. B Nrf2 expression was also quantified by qRT-PCR normalized against GAPDH in blood samples of study subjects at pre- and post-treatment phage. Data is represented here as mean ± SD, and the Mann–Whitney test was carried out to compare Shh and Nrf2 expression before and after treatment. * p-value < 0.05, *** p-value < 0.005, two-tailed unpaired t-test

