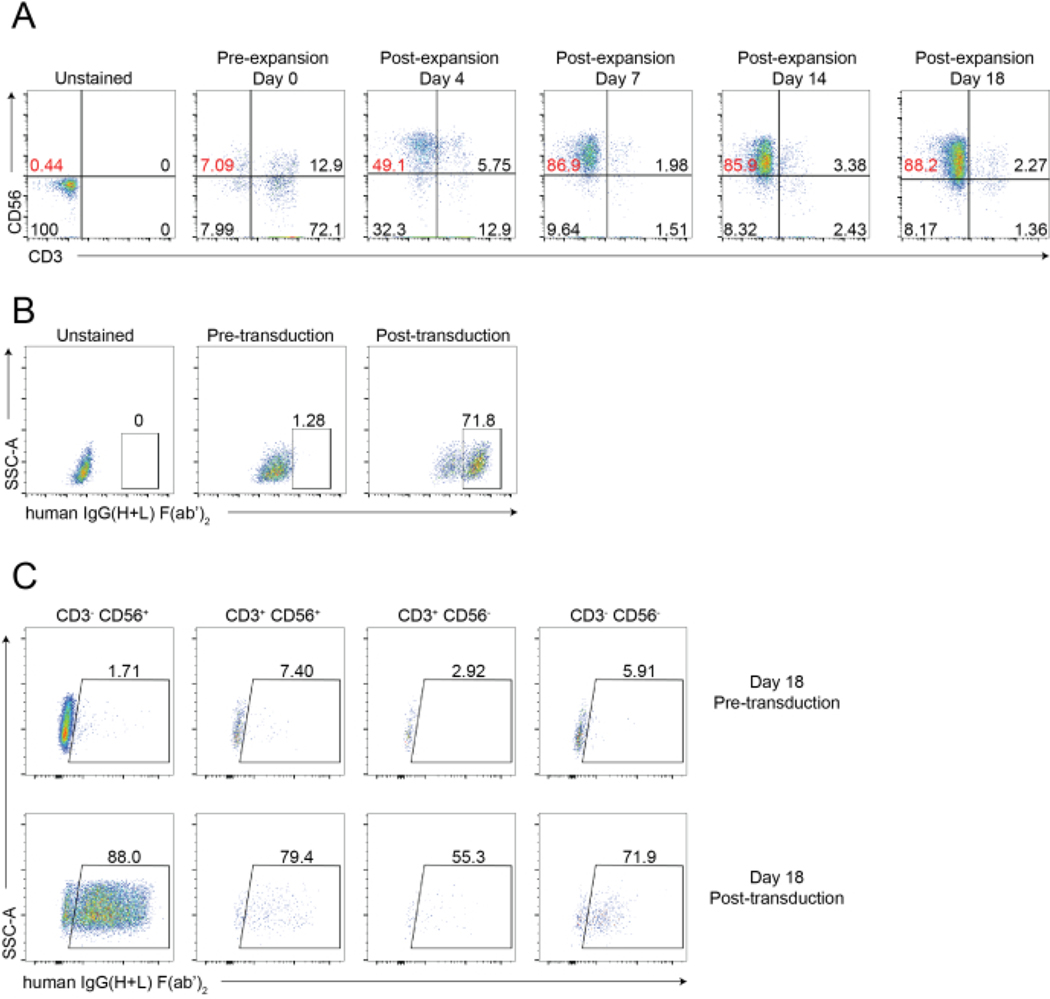
Figure 4: Representative flow cytometric analysis of CAR-NK cells.
(A) Representative dot plots showing the dynamic time-lapse of NK cell purity of the CAR-NK cells during an 18-day course. Flow cytometry analysis was assessed by staining the cells with anti-CD56 and anti-CD3 at indicated timepoints. Day 0 indicates pre-expansion of PBNK. Day 4 indicates post-expansion of PBNK and pre-transduction of CAR-NK cells. Day 7 indicates the post-transduction of CAR-NK cells. (B) Representative dot plots showing the transduction efficiency of CAR-NK cells using the retrovirus packaging system. Cells were stained with anti-CD56, anti-CD3, and anti-hIgG(H+L) F(ab’)2 for flow cytometry. (C) Representative dot plots showing the CAR expression in various subsets, including CD56+CD3−, CD56−CD3+, CD56+CD3+, and CD56−CD3− on Day 18. Cells were stained with anti-CD56, anti-CD3, and anti-hIgG(H+L) F(ab’)2 (indicating CAR expression) for flow cytometry.

