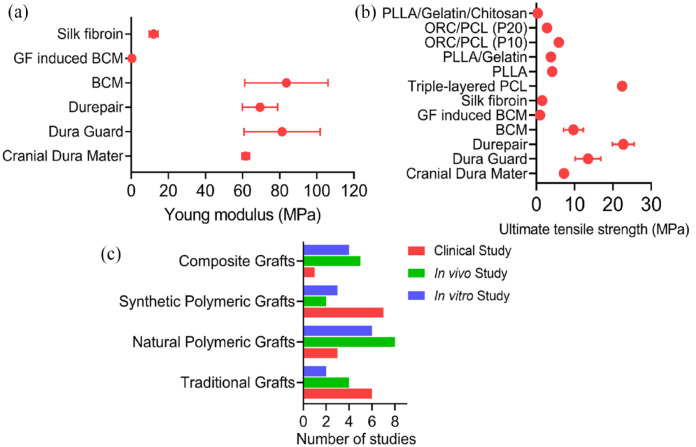
Figure 11.
Graphical representation of the mechanical properties and proportion of studies performed on various types of grafts: (a) ultimate tensile strength for various dural substitutes,11,16,20,28,31,35,36,45,47,97 (b) Young’s modulus for different dural substitutes,11,28,31,35,97 and (c) ratio clinical, in vivo and in vitro study for the dural grafts.1,10,11,16,18,21 –47,72

