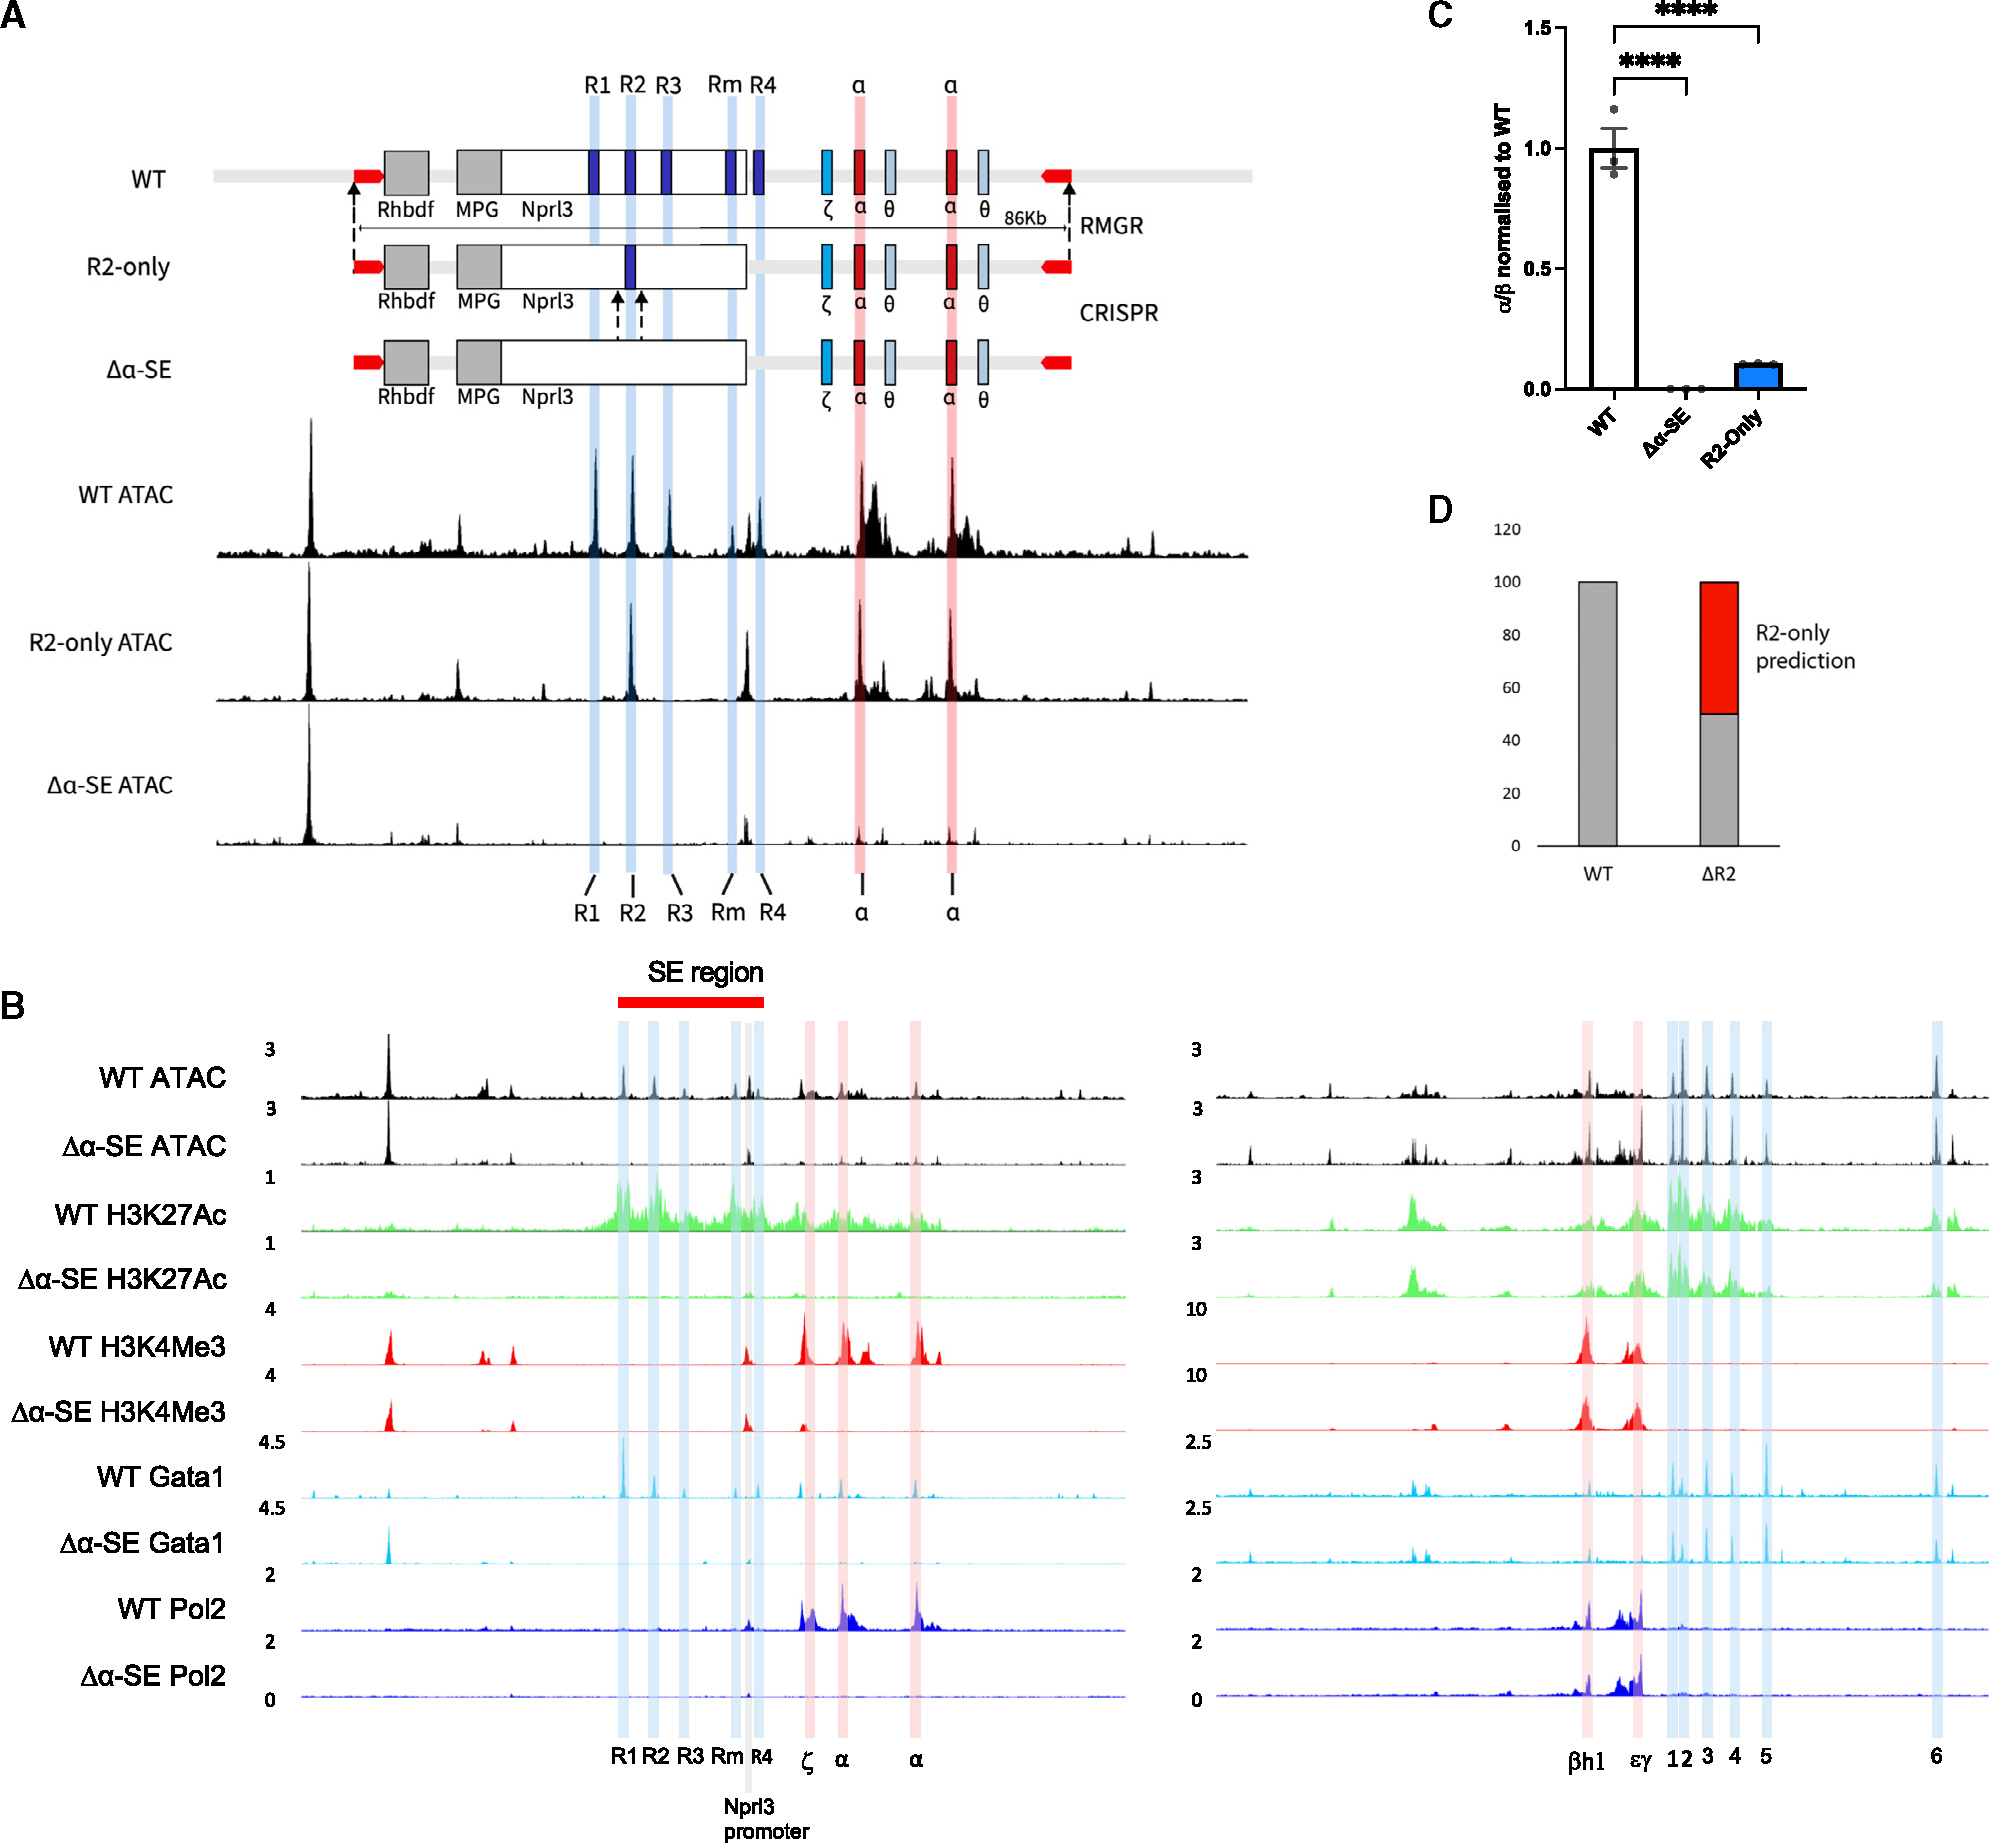
Figure 1. Generation of an enhancerless (Δα-SE) in vitro mouse model and an R2-only in vivo mouse model to test the sufficiency of the R2 enhancer element.

(A) A graphical representation of the design of the Δα-SE and R2-only α-globin loci. R2-only locus was synthesized, assembled into a bacterial artificial chromosome (BAC), and delivered into the wild-type (WT) α-globin locus through recombination-mediated genomic replacement (RMGR; STAR Methods). Δα-SE was generated by CRISPR deletion of R2 from the R2-only hemizygous mESCs. UCSC tracks represent cpm (count per million) normalized ATAC-seq data from WT (top), R2-only FL erythroid cells (middle), and Δα-SE EB-derived erythroid cells (bottom).
(B) ATAC-seq from WT and Δα-SE EB-derived erythroid cells (top) and ChIPmentation for H3K27Ac, H3K4Me3, GATA1, and Pol II (bottom; n ≥ 2). Left, α-globin locus with highlighted regulatory elements (R1–R4, blue) and promoters (Hba-x or ζ corresponding to the embryonic α-globin and Hba-a1, Hba-a2, or α corresponding to the adult α-globin expressed in EB-derived primitive erythroid cells, red; Nprl3 promoter, pink); right, β-globin locus with highlighted regulatory elements (HS1–HS6, blue) and promoters (Hbb-h1 or βh1 and Hbb-y or εγ corresponding to the embryonic β-globin expressed in EB-derived primitive erythroid cells, red). All tracks are cpm normalized.
(C) α-globin gene expression in WT, Δα-SE, and R2-only EB-derived erythroid cells (n ≥ 3) assayed by RT-qPCR. Expression normalized to β-globin and displayed as a proportion of WT expression. Dots, biological replicates; error bars, Standard Error. Statistical analysis was performed using one-way ANOVA with a Tukey post-hoc test: ****p ≤ 0.00001.
(D) Prediction of R2-only α-globin gene expression, calculated by subtracting ΔR2 α-globin expression from WT and the observed R2-only expression levels in (C).
See also Figures S1 and S3.
