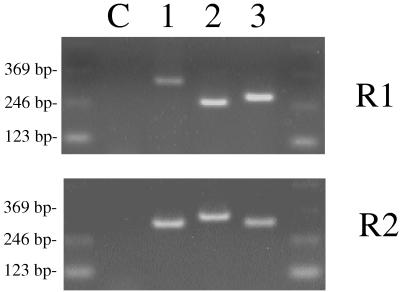
FIG. 4.
Analysis of size variation in the P97 repeat regions by PCR analysis. The bands represent PCR products produced from template DNA from different M. hyopneumoniae strains. Lane C, no template DNA control; lane 1, strain 232A (adherent); lane 2, strain J (nonadherent); lane 3, strain 144L (adherent). R1 and R2 were amplified with primer sets TH120-TH121 and TH122-TH123, respectively.

