
Fig. 1. Cumulative associations of WQSR mixture with A) progesterone, B) estradiol, C) testosterone, D) free T4, E) total T4, F) TSH.
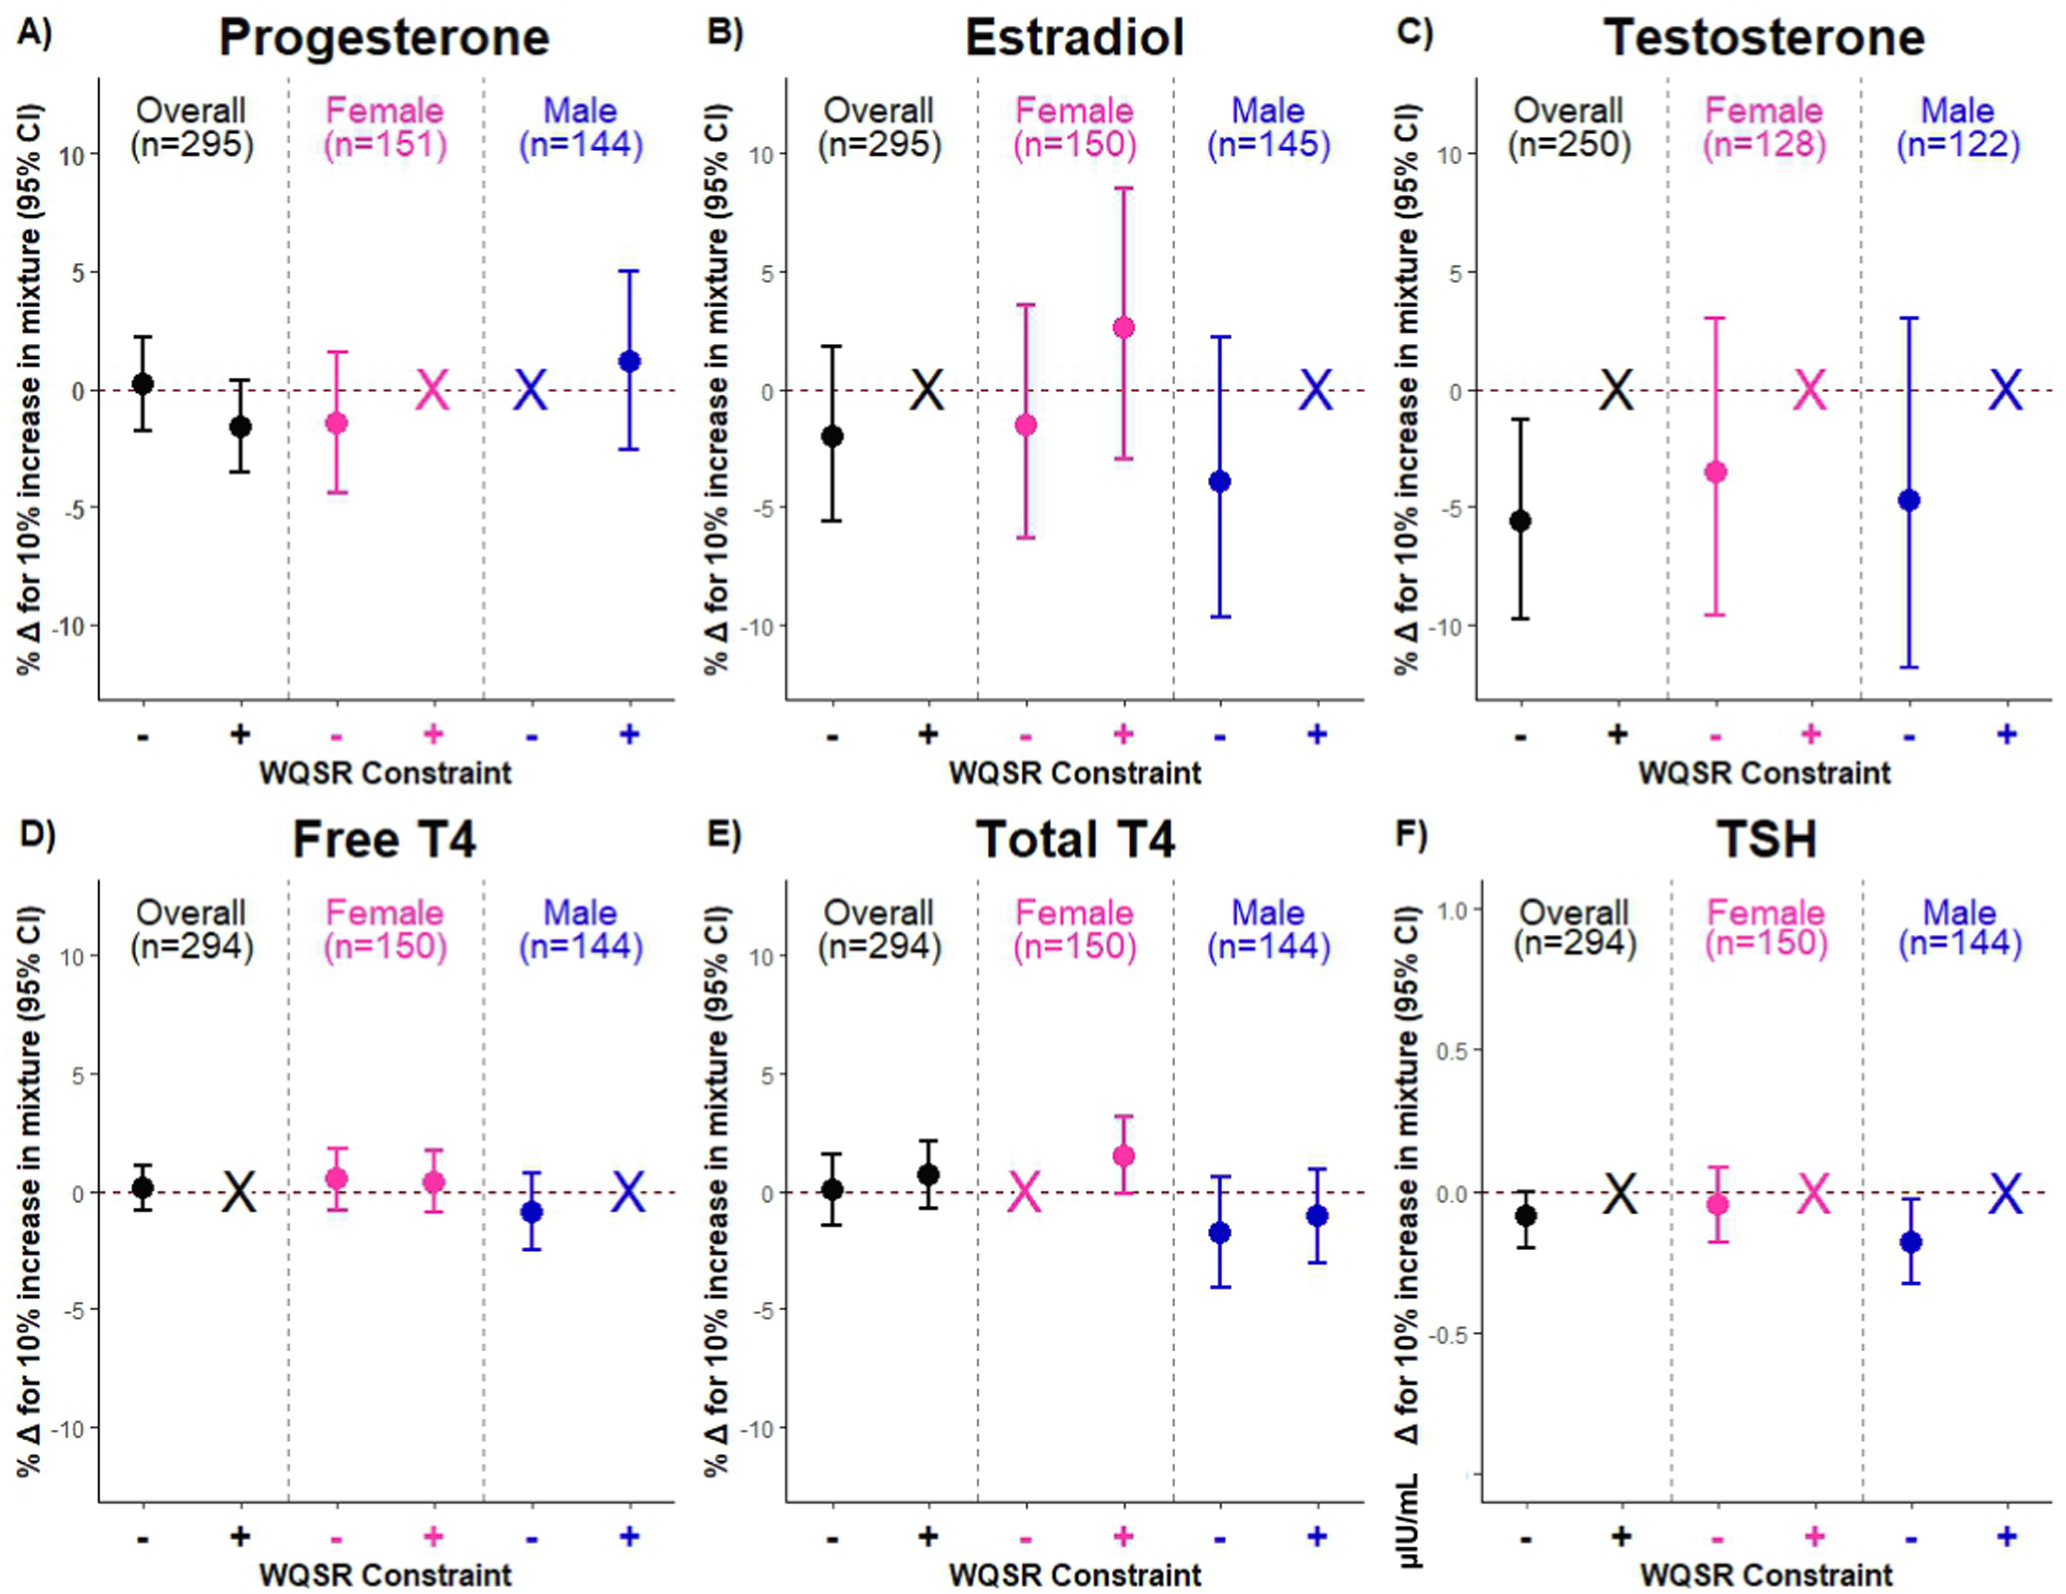
Negatively (−) and positively (+) constrained WQSR models were fit with 100 bootstraps and 100 repeated holdouts accounting for educational attainment, age, diet quality, pre-pregnancy body mass index, perceived stress in early pregnancy, lifetime smoking status, parity, race/ethnicity, gestational age at plasma hormone assessment, women carrying females, and women carrying males. Data are presented as the percent change (%Δ) and 95 % CI in plasma hormone concentrations with every 10 % increase in the WQSR mixture. For TSH, data are presented as μIU/mL change and 95 % CI in TSH for every 10 % increase in the WQSR mixture. Estimate and interval color signifies analytic sample (all women: black; women carrying females: pink; women carrying males: blue), and X indicates non-positive or non-negative β-estimates. For TSH, y-axis is on a different scale for data visualization. Abbreviations: CI, confidence interval; T4, thyroxine; TSH, thyroid stimulating hormone; WQSR, Weighted Quantile Sum Regression.