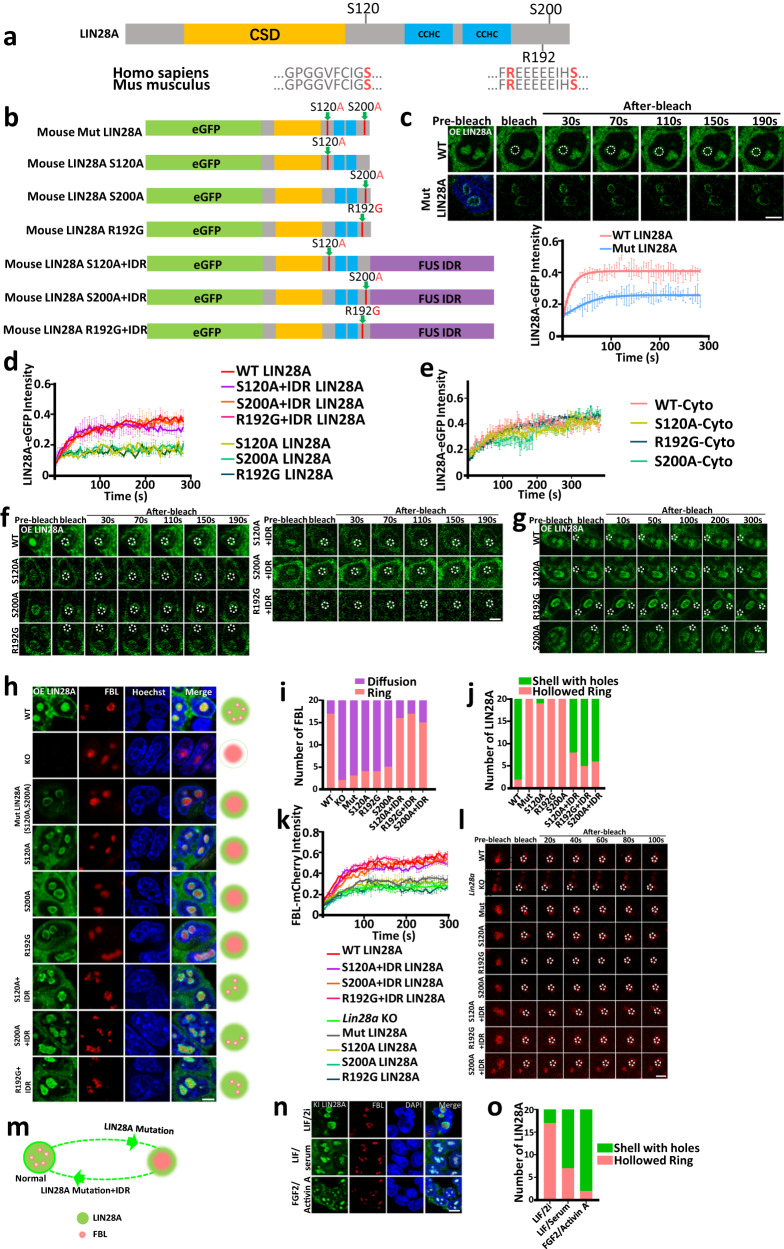
Fig. 4. Key amino acids at the IDR region are essential for LIN28A and nucleolar phase separation.
a Schematic illustration of human and mouse LIN28A domains. b Constructs of individual mutation of mouse LIN28A. c FRAP analysis showing WT-LIN28A and Mut-LIN28A recovery after photobleaching in the nucleolus. Shown representative images. Scale bar, 5 µm. d FRAP analysis showing WT-LIN28A, S120A, S200A, R192G, and IDR fusions recovery after photobleaching in the nucleolus. e FRAP analysis showing WT-LIN28A, S120A, S200A, and R192G variants recovery after photobleaching in the cytoplasm. f Representative images of fluorescence recovery after photobleaching (FRAP) of LIN28A variants in (d) in the nucleolus. Scale bar, 5 µm. g Representative images of fluorescence recovery after photobleaching (FRAP) of LIN28A variants in (e) in the cytoplasm. Scale bar, 5 µm. h Representative confocal microscopy Airyscan images of the morphology and nucleolar localization of LIN28A and FBL in living WT, Lin28a KO, and Lin28a KO cells transduced with Mut-LIN28A, S120A LIN28A, S200A LIN28A, R192G LIN28A, and FUS protein’s IDR fused LIN28A variants cultured in LIF/Serum medium. Scale bar, 5 µm. i Statistical analysis of the numbers of the typical morphology of FBL in (h); n = 20 nucleoli. Fisher Exact Test, two-sided; WT vs KO:p = 3.35795E-06, WT vs Mut:p = 1.93853E-05, WT vs S120A:p = 8.75018E-05, WT vs R192G:p = 8.75018E-05, WT vs S200A:p = 0.000328419, WT vs S120A + IDR:p = 1, WT vs R192G + IDR:p = 1, WT vs S200A + IDR:p = 0.6947647. j Statistical analysis of the numbers the typical morphology of LIN28A in living WT, and Lin28a KO cells transduced with Mut-LIN28A, S120A-LIN28A, S200A-LIN28A, R192G-LIN28A, and FUS protein’s IDR fused LIN28A variants; n = 20 nucleoli. Fisher Exact Test, two-sided; WT vs KO:p = 3.35155E-09, WT vs S120A:p = 5.81952E-08, WT vs R192G:p = 3.35155E-09, WT vs S200A:p = 3.35155E-09, WT vs S120A + IDR:p = 0.06483316, WT vs R192G + IDR:p = 0.4074844, WT vs S200A + IDR:p = 0.2351162. k FRAP analysis showing FBL-mCherry recovery after photobleaching in (h). l Representative FRAP images of FBL in (h). Scale bar, 5 µm. m A cartoon diagram showing morphological changes of LIN28A and FBL. n Confocal microscopy Airyscan images of the morphology and Localization of LIN28A and FBL in eGFP-LIN28A knock-in E14 mESCs cultured in LIF/2i(Naïve), LIF/Serum, FGF2/Activin A(Primed) medium. Scale bar, 5 µm. o Statistical analysis of the numbers the typical morphology of LIN28A in eGFP-LIN28A knock-in E14 mESCs cultured in LIF/2i(Naïve), LIF/Serum, FGF2/Activin A(Primed) medium; n = 20 nucleoli. Fisher Exact Test, two-sided; Naive vs LIF/Serum:p = 0.003056449, Naive vs Primed:p = 3.35795E-06.For c–h, k, l, n, three times biologically independent experiments were performed. For c, d, e, k, data are presented as mean values +/− SEM. Source data are provided as a Source Data file.

