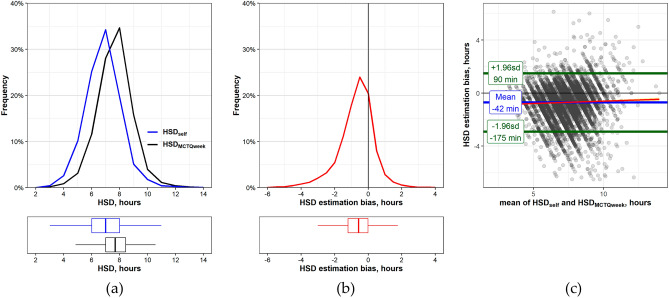
Figure 1.
Habitual sleep duration (HSD) by Method-Self and Method-MCTQweek. (a) Upper panel—HSD distributions, percent from group total by method: blue line—HSDself, black line—HSDMCTQweek, 1-h bin. Lower panel—Boxplots of individual HSD by method. Whiskers—max and min values, box borders—75th and 25th percentiles, line through the box—median. (b) Upper panel—HSD estimation bias values distribution, percent from group total, 30-min bin. Lower panel—Boxplots of individual HSD estimation bias values. (c) Bland–Altman plot comparing Method-Self and Method-MCTQweek. The blue line indicates that the Method-Self sleep duration estimates are on average 42 min shorter than Method-MCTQ estimates. The green lines indicate the 95% limits of agreement (± 1.96SDs). The linear regression line (red) shows that the HSD estimation bias is stable through the whole range values. The two methods only agree to within ± 2.2 h.

