
Fig. 3. The slow-fast trait axis of individual guilds is strongly related to land-use intensity.
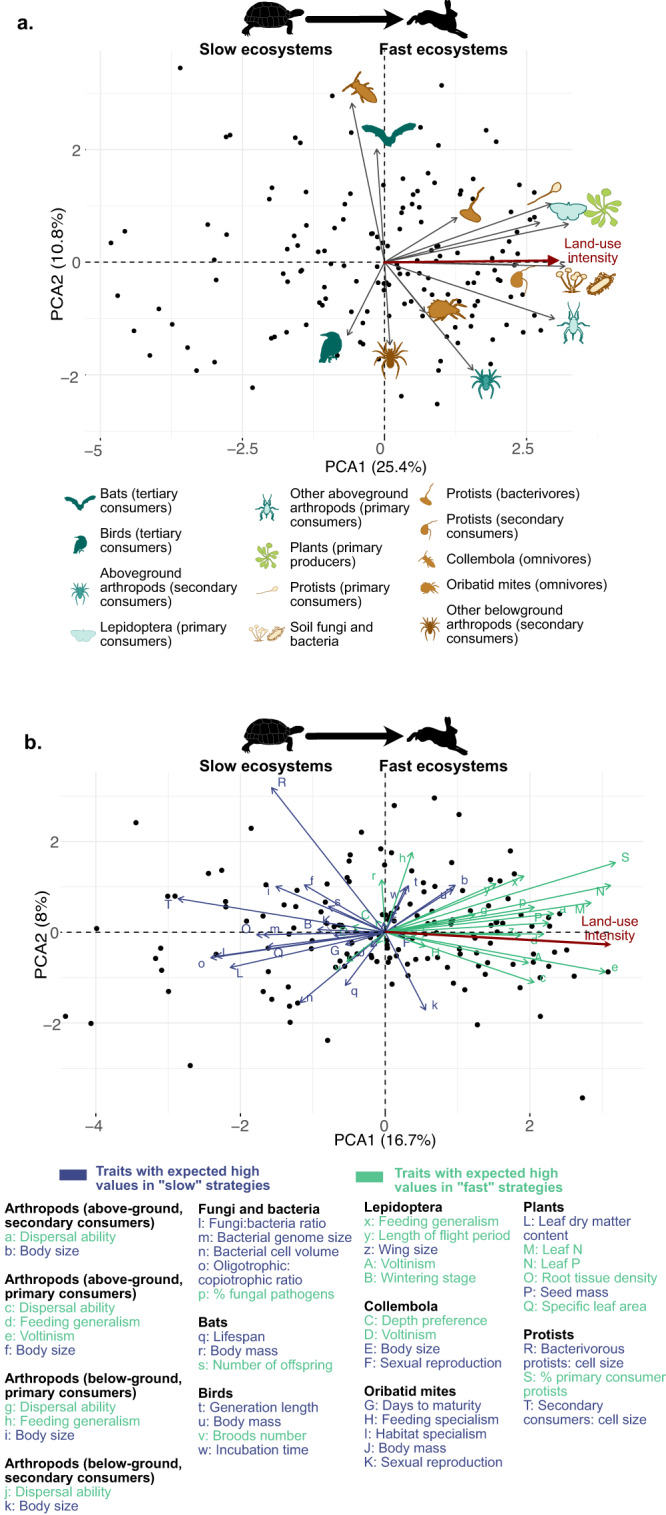
a Whole community slow-fast axis, based on guild-level slow-fast axes. The variables included in the PCA are the slow-fast axes of each guild, which were estimated as the PC axis that best represents the hypothesised slow-fast axis (PC1 in 90% of cases) in a PCA of the selected CWM traits expected to be related to slow-fast strategies for each guild individually. These guild-level PCA can be found in Fig. 2. Land-use intensity (which is projected on the PC axes, shown in dark red) is strongly associated with Axis 1. Belowground guilds are shown in brown, aboveground guilds in blue, and plants in green. b Whole community slow-fast axis, based on all traits. In contrast to the results shown in a, the PCA was conducted on all traits, at the CWM level. Each trait was weighted as 1/n, with n with n the number of traits available for the guild, so that all guilds are weighted equally. Traits expected to be ‘slow' are coded in blue, ‘fast' in green. Sample size: 150 (sample sizes for each individual guild are shown in Fig. 4, missing values were imputed to run the PCA, see Methods). Icons were acquired and adapted from Phylopic.org (artists: M. Dahirel, B. Lang, M. Crook, J. A. Venter, H. H. T. Prins, D. A. Balfour, R. Slotow, T. M. Keesey, A. A. Farke, Y. Wong, G. Monger).