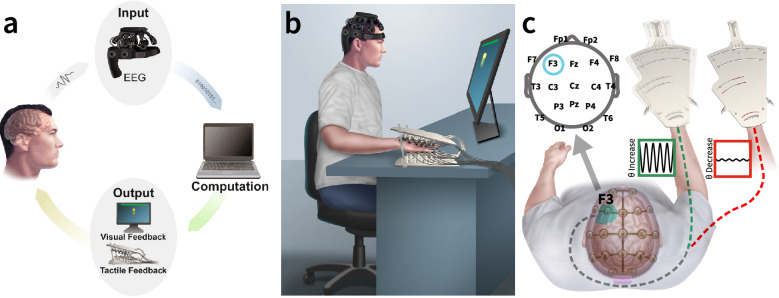
Figure 1.
Schematic and description of BCI system. (a) System overview schematic of EEG-driven BCI system consisting of EEG signals as input and dual visual and vibrotactile sensory feedback. Electrophysiological activity is recorded using a 24-channel dry EEG headset connected to a PC laptop via Bluetooth. The PC uses BCI2000 for real-time signal processing (i.e., extrapolating frontal midline θ power changes) and command execution (i.e., initiating visual and tactile feedback in response to changes in frontal θ power). Visual feedback was delivered on an external monitor, and tactile feedback was delivered using the custom HVSA. (b) System set up with BCI system with vibrotactile feedback system enclosing the affected hand. (c) Overview of electrode configuration (Top-left) and vibrotactile neurofeedback. Increased F3 θ modulation (teal) during relevant phases of BCI therapy leads to vibrotactile feedback of the affected area (green). No modulation of θ or decreased modulation of θ leads to no vibrotactile feedback (red).

