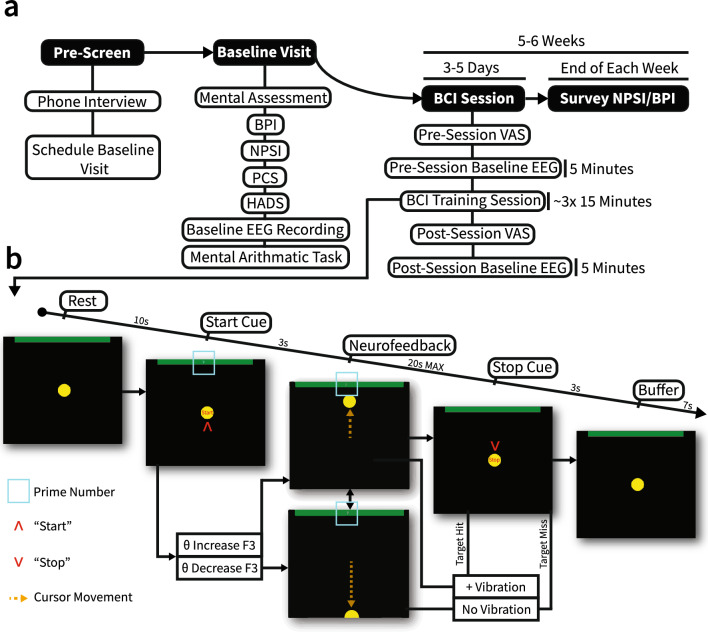
Figure 2.
Overview of BCI therapy. (a) Overall treatment timeline. Solid black shapes indicate the main therapy sections. White shapes indicate specific breakdowns of each main section. (b) Overview of a single BCI trial. The teal box shows the numerical stimulus used in early BCI sessions to induce θ modulation. “Start” and “Stop” cues are indicated by red arrows. Cursor movement is indicated by the orange dotted arrow. Trial states progress from left to right. θ modulation direction leads to movement of the cursor during neurofeedback. The neurofeedback period was the only period with a variable duration, with 20 s being the maximum duration of the neurofeedback. If the cursor reaches the green target at the top of the screen, several pulses of vibration are delivered to the affected area over the duration of the “Stop” cue.

