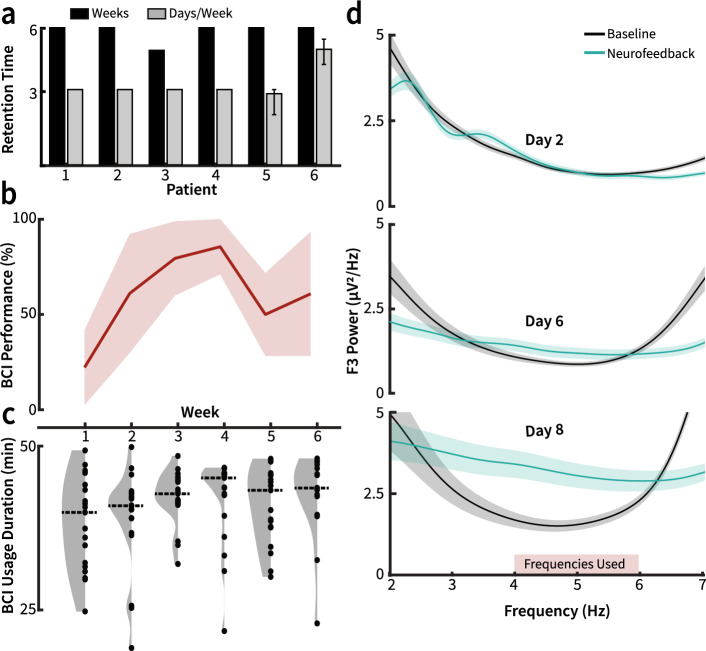
Figure 3.
Intervention feasibility. (a) Each patient’s intervention time. Black bars represent the number of weeks each patient underwent BCI training. Gray bars represent the mean number of BCI training days per week. Error bars represent the range of days per week completed. All patients underwent at least 3 days of BCI training per week for 5 weeks. Four of the patients completed 3 days of BCI training every week. One patient completed 3 days of training per week for 5 weeks, then completed 2 days of training on the sixth week (range 2–3, where only two sessions were completed on the sixth week). One patient completed 4–5 days of training per week for 6 weeks (range 4–5). (b) Median BCI performance across all participants across 6 weeks of BCI therapy. The shaded region depicts the median absolute deviation. (c) Violin plots reflecting session duration across all patients each week. The dotted line represents the median session time across all patients each week. There was no significant difference in session duration between weeks (n = 19, 20, 19, 19, 19, 16; Kruskal–Wallis test, df = 5, χ2 = 8.28, p = 0.14). (d) Exemplar power spectral density plots comparing average θ range power during rest and neurofeedback phases of BCI training for patient 1. Shaded regions represent standard error. θ modulation increases over BCI training sessions. The red rectangle indicates frequencies used for BCI real-time signal processing.

