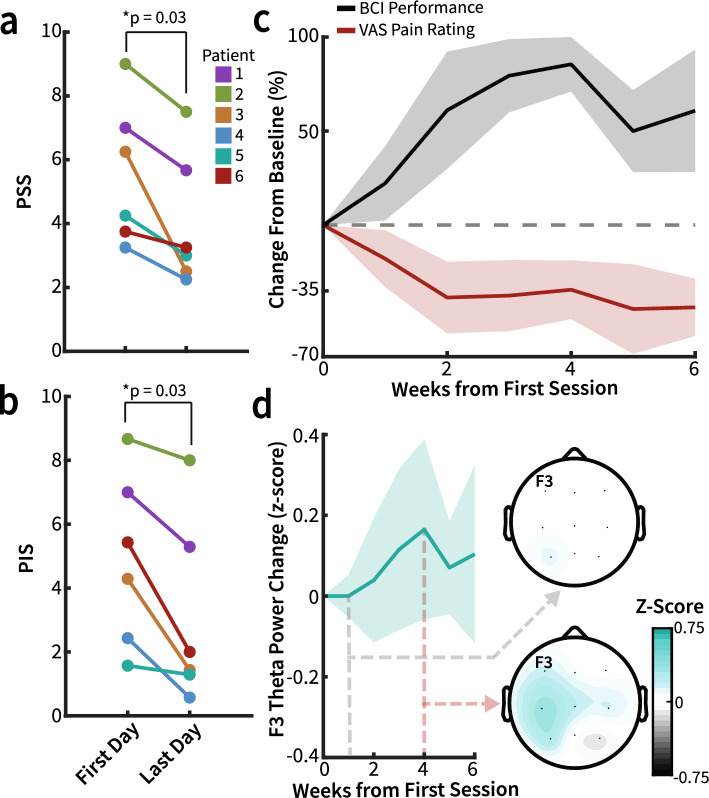
Figure 4.
Vibrotactile BCI therapy decreases chronic pain symptoms. Individual patient outcomes: (a) PSS (N = 6, Wilcoxon signed-rank, median decrease 1.29 ± 0.25 MAD p = 0.03, q = 0.05) and (b) PIS (N = 6, Wilcoxon signed-rank, median decrease 1.79 ± 1.10 MAD p = 0.03, q = 0.05) significantly decreases after the BCI intervention duration. (c) Median BCI performance and VAS rating for all participants across the BCI therapy intervention duration. Across sessions, BCI performance improves while VAS pain rating decreases. The shaded region depicts the median absolute deviation (MAD). (d) The median baseline θ power over the course of BCI therapy at electrode location F3 across participants with either significant pain reduction or consistent BCI performance over the ROC calculated optimal threshold (n = 4). Topography plots show median θ power across all electrodes during the first week (upper) and fourth week (lower, where baseline F3 θ was highest). Data were z-scored to baseline θ power, with shaded regions representing MAD.

