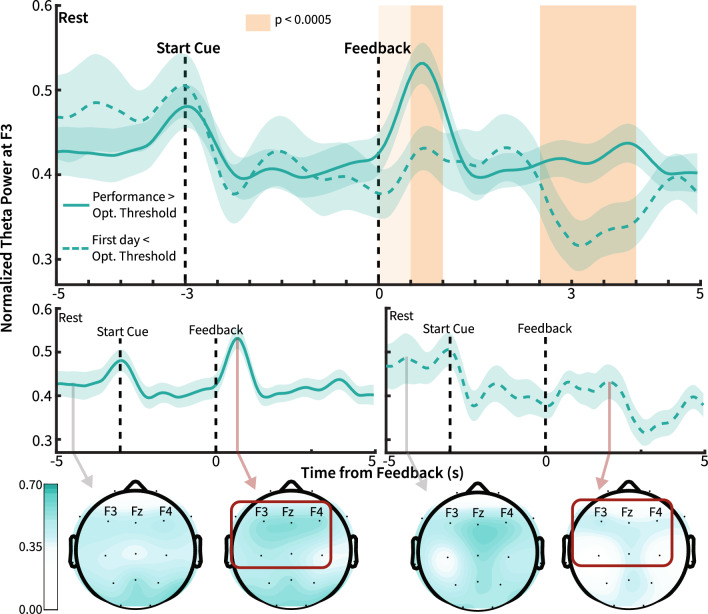
Figure 5.
Differential θ modulation before and after BCI control. Top and Center: Patient normalized θ power during sessions with performance above optimal threshold (solid line) and first-day sessions below optimal performance threshold (dashed line). The optimal threshold was determined using ROC analysis to estimate the performance cutoff for BCI sessions with the greatest likelihood of significant θ modulation during neurofeedback. Black dashed lines indicate the onset of the start cue and neurofeedback spans. Orange shading indicates p values at durations without standard error overlap. Light orange shows duration without overlap between traces (500 ms window, n = 60, p = 0.006). Dark orange indicates durations of statistically significant differences between time traces (500 ms window, n = 60, Wilcoxon rank sum test, p < 0.0005, Bonferroni Corrected). The line shows averaged power values across each within-subject average, with the shaded region showing average standard error. Bottom: Topography of the normalized θ power during baseline and peak normalized θ during neurofeedback before and after BCI control. Theta power increases are localized to frontal channels during high BCI performance.

