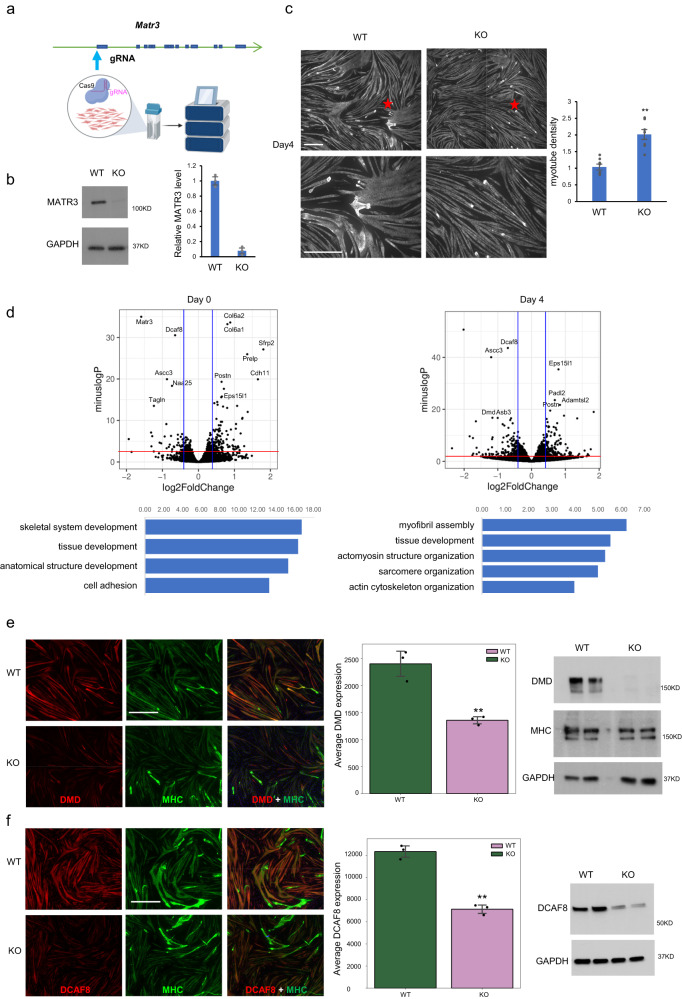
Fig. 1. Matr3 loss leads to defects in myogenesis.
a Generation of Matr3 knockout (KO) bulk using Cas9/RNP transfection (see methods). Figure created with BioRender.com. b Matr3 protein level was reduced significantly in Matr3KO bulk. MATR3 expression was assessed in wildtype and Matr3 KO C2C12 cells by Western blot and quantified (n = 3 independent experiments). p = 1.25E-05, by two-sided t test. c Myotubes in Matr3 KO exhibited a significantly increased density than wildtype. C2C12 Matr3 KO and wildtype were differentiated for 4 days, and immunostained with Myosin heavy chain. The bottom images were magnified views from the regions marked with stars in upper images. Myotube intensity in Matr3KO and WT were quantified (n = 8 independent samples). p = 2.96E-05, by two-sided t test. All the images were taken from the same regions in each replicate using Yokogawa CV7000 microscope with the same setting. Scale bar, 500 µm. b, c data are presented as mean values ±SEM. d Knockout of Matr3 contributed to differential gene expression. RNA-seq of cells at myoblast (Day0) and myotube (Day4) stages. Expression changes were measured by KO-WT. In volcano plots, p values from the Wald test less than 0.05 (p < 0.05) for red line, and log2FC > 0.4 for the vertical blue lines denote significant DE genes. DE genes were associated with skeletal muscle development (GO term, bottom panel). e Duchenne muscular dystrophy gene (DMD) expression was reduced in Matr3 KO myotubes. C2C12 Matr3 KO and wildtype were differentiated 4 days, and immunostained with DMD (red) and MHC (green). Signal intensity was quantified (n = 3). Scale bar, 500 µm. p = 0.0089, by Mann-Whitney U test. Protein level of DMD was confirmed by Western blots (right panel), and 2 independent experiments were repeated with similar results. f DCAF8 expression was reduced in Matr3 KO myotubes. C2C12 Matr3 KO and wildtype were differentiated 4 days, and immunostained with DCAF8 (red) and MHC (green). Signal intensity was quantified (n = 3). Scale bar, 500 µm. p = 0.00016, by Welch’s t test. Protein level of DCAF8 was confirmed by Western blot (right panel), and 2 independent experiments were repeated with similar results. e, f data are presented as mean values ±SD. Source data are provided as a Source Data file.

