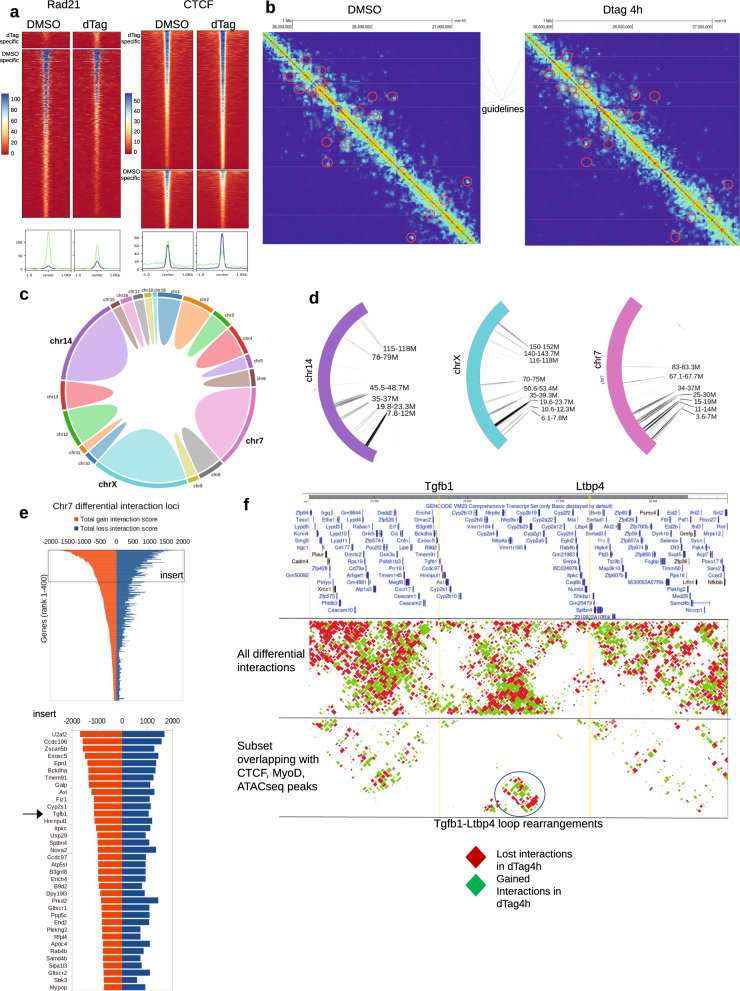
Fig. 4. Matr3 depletion extensively rearranges loop domain interactions.
a Substantial reduction of Rad21 binding 4 h. following Matr3 depletion. CTCF occupancy was marked by both gains and losses. The histograms below summarize the binding intensities (green: lost peaks, blue: gained peaks). b Example of loop rearrangements derived from Hi-C experiments that characterized the effect on chromatin structure at fragment resolution (on average 5 kb). Red circles denote sites of differential interactions. c Distribution of the number of differential interactions across all chromosomes. d Chromosomes 14, X, and 7 exhibited the greatest interaction changes with most rearranged regions indicated. e A ranking of gene promoters with most differential interactions on Chromosome 7, in which Tgfb1 was ranked near the top (see insert). f Interaction landscape at the Tgfb1 region on Chromosome 7 revealed interweaving patterns of interaction gains (green) and losses (red). Certain sites harbored more interaction changes than others. Notable was Tgfb1-Ltbp4 loop rearrangement (circled) which also overlapped with CTCF, MyoD, ATACseq peaks. Rearrangement was formed between Tgfb1 (highlighted by yellow line), and Ltbp4 (yellow line) and bore the signature of adjacent gains and losses at the same location. Source data are provided as a Source Data file.

