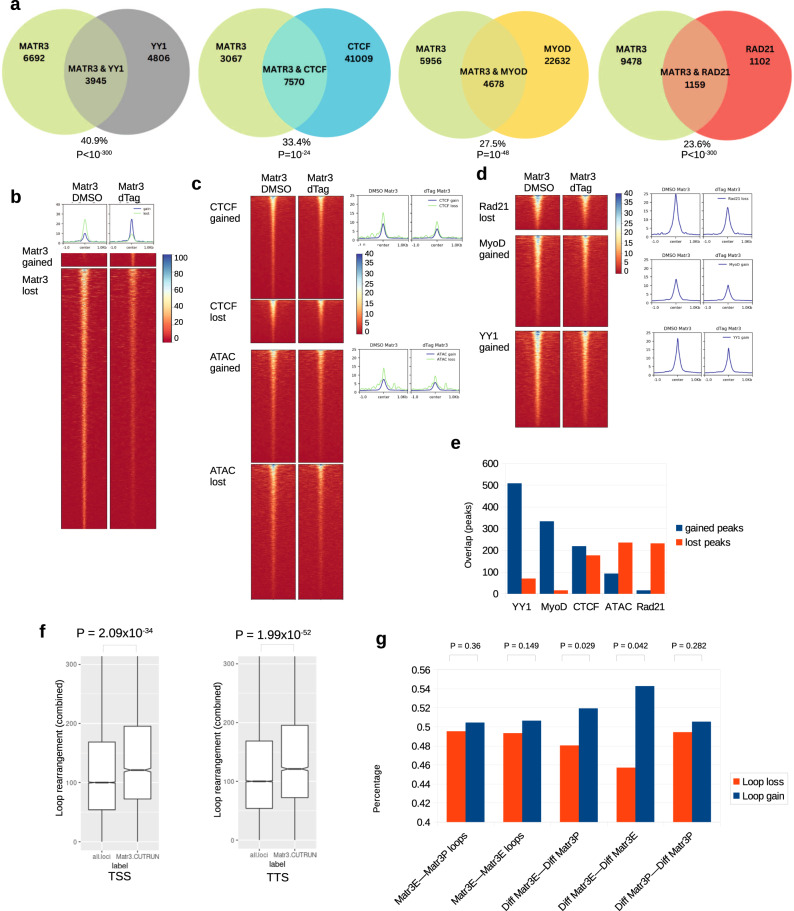
Fig. 7. Matr3 depletion directly impacts Rad21, CTCF, MyoD and YY1 occupancy, chromatin accessibility, and chromatin looping.
a Overlap between Matr3 occupancy (profiled by CUT&RUN) and YY1, CTCF, MyoD, and Rad21 occupancy. Hypergeometric test (one-sided) with multiple comparisons by BH method. b Heatmap showing Matr3 occupancy (CUT&RUN) at 4 h. post Matr3 depletion (dTAG) compared with control (DMSO). c Heatmaps showing regions with reduced Matr3 occupancy exhibit differential CTCF occupancy and differential chromatin accessibility. Right: histograms showing Matr3 CUT&RUN signal magnitude. d Heatmaps showing regions with reduced Matr3 occupancy exhibit lost Rad21, gained Myod, gained YY1 occupancies. Right: histograms showing Matr3 CUT&RUN signal magnitude. Note that Matr3 signals at Rad21, MyoD, YY1 locations are stronger than those of CTCF and ATAC-seq in (c). e Co-occurrence of differential Matr3 occupancy with YY1, MyoD, CTCF, Rad21 occupancy and ATAC-seq. Number of shared differential peaks between Matr3 loss with YY1 gains was highest. f TSS (transcription start sites) and TTS (transcription-termination sites) that occupied by Matr3 are more enriched for loop rearrangements than random loci. n = 3 biologically independent experiments. For TSS boxplot: N = 16990 (all.loci), N = 1993 (Matr3.CR). For TTS boxplot: N = 16990 (all.loci), N = 1098 (Matr3.CR). Boxplot shows the median, 3rd quartile (upper-bound), and 1st quartile (lower-bound). Notches in the boxplot extend the range of median ± 1.58 * IQR/sqrt(n) where IQR is the inter-quartile range. The whiskers extend no further than 1.5 * IQR from the hinge, and no lower than 1.5*IQR of the bottom hinge. Welch’s t test (unequal variance), no multiple comparison. g Different scenarios of E-P & E-E loop gains and loss at Matr3-occupied anchors. Anchors characterized by reduced Matr3 occupancy exhibited increased E-E and E-P loops. Matr3E—Matr3P loops, E-P loop anchors with no Matr3 occupancy change (1st dataset). Matr3E—Matr3E loops, E-E loops with no Matr3 occupancy change (2nd dataset). Diff Matr3E—Diff Matr3P, E-P loop with reduced Matr3 occupancy (3rd dataset, p = 0.029). Diff Matr3E—Diff Matr3E, E-E loop with reduced Matr3 occupancy (4th dataset, p = 0.042). Diff Matr3P—Diff Matr3P, P-P loop with reduced Matr3 occupancy (5th dataset). Wilcoxon’s rank-sum test (one-sided), multiple comparisons by BH method. Source data are provided as a Source Data file.

