Abstract
Noncoding variants of presumed regulatory function contribute to the heritability of neuropsychiatric disease. 2221 noncoding variants connected to risk for 10 neuropsychiatric disorders, including autism spectrum disorder, attention deficit hyperactivity disorder, bipolar disorder, borderline personality disorder, major depression, generalized anxiety disorder, panic disorder, post-traumatic stress disorder, obsessive-compulsive disorder, and schizophrenia, were studied in developing human neural cells. Integrating epigenomic and transcriptomic data with massively parallel reporter assays identified differentially-active single-nucleotide variants (daSNVs) in specific neural cell types. Expression-gene mapping, network analyses, and chromatin looping nominated candidate disease-relevant target genes modulated by these daSNVs. Follow up integration of daSNV gene editing with clinical cohort analyses suggested that magnesium transport dysfunction may increase neuropsychiatric disease risk and indicated that common genetic pathomechanisms may mediate specific symptoms that are shared across multiple neuropsychiatric diseases.
Introduction
Genome-wide association studies (GWAS) of neuropsychiatric disorders have identified thousands of risk loci, most of which reside in noncoding DNA of possible regulatory function in neural cell types1–5. Decoding mechanisms whereby such variants mediate disease risk has proved difficult. First, most GWAS-identified single nucleotide polymorphisms, or variants (SNVs), are in linkage disequilibrium (LD) with other adjacent SNVs6, underscoring the need for single-nucleotide resolution studies of allele-specific activity. Second, most GWAS variants reside in noncoding DNA regions distal to brain-expressed coding genes7, making variant-gene linkage challenging8. Finally, many neuropsychiatric disorders may arise, in part, from dysfunctions during brain development9, emphasizing the need to assess variants in models of human neural differentiation. A single-nucleotide resolution resource of risk variants with altered transcription-directing activity in human neural cell types may nominate dysregulated target genes to features of neuropsychiatric disease10.
Here, we present a single-nucleotide resolution compendium of functional, differentially-active SNVs (daSNVs) in regulatory DNA associated with 10 human neuropsychiatric diseases along with an analytical framework to assess how these variants dysregulate pathways implicated in disease. SNVs were identified from GWAS of autism spectrum disorder (ASD), attention deficit hyperactivity disorder (ADHD), bipolar disorder (BPD), borderline personality disorder (BLPD), major depressive disorder (MDD), generalized anxiety disorder (GAD), panic disorder (PD), post-traumatic stress disorder (PTSD), obsessive-compulsive disorder (OCD), and schizophrenia (SCZ). Massively parallel reported assays (MPRA) compared activity in matched risk versus reference allele pairs in embryonic stem (ES) cells and ES cell-derived human neural progenitor cells (NPC), differentiating neurons, and glial cells. MPRA identified 892 daSNVs with differing transcription-driving function from non-risk counterpart alleles, many with neural cell-state specific differential activity. Transcriptomic, chromatin accessibility, and looping data from human neural cell types were generated and integrated with expression quantitative trait loci (eQTL) data to link daSNVs to dysregulated target genes (eGenes). The resulting 641 putative eGenes contain multiple known and novel drug targets within protein interaction networks implicated in neurologic function. Integration of daSNV-eGene-pathway connectivity with population-scale genotyping-clinical data nominated pathomechanisms for specific neuropsychiatric symptoms. These data provide a single-nucleotide resolution resource of functional variants linked to common human neuropsychiatric disorders and provide a framework to connect these variants to shared pathomechanisms, therapeutics, and clinical features.
Results
Active regulatory variants linked to disease
To identify neuropsychiatric daSNVs that alter transcription-directing activity, MPRA11,12 was used. 2221 variant pairs were prioritized by first curating neuropsychiatric GWAS-indexed SNVs and clinically annotated, disease relevant SNVs (n=15,904 initial SNVs), expanding them to all SNVs in LD (r2>0.8) then filtering through DNase I hypersensitive data from ENCODE in 40 different neural and immune cell types (Fig. 1, Fig. 2A, table S1). GTEx eQTL datasets13 were used to annotate potential target genes for these 2221 variants. On average, 5 SNVs were tested per locus. SNVs tested reflected the genomic associations currently available. For instance, neuropsychiatric GWAS datasets are most extensive for SCZ, and thus roughly half of the tested variants were associated with this disorder. Additionally, roughly 12% of the SNVs tested were associated with more than one disease, indicating possible shared genetic signals across multiple neuropsychiatric disorders.
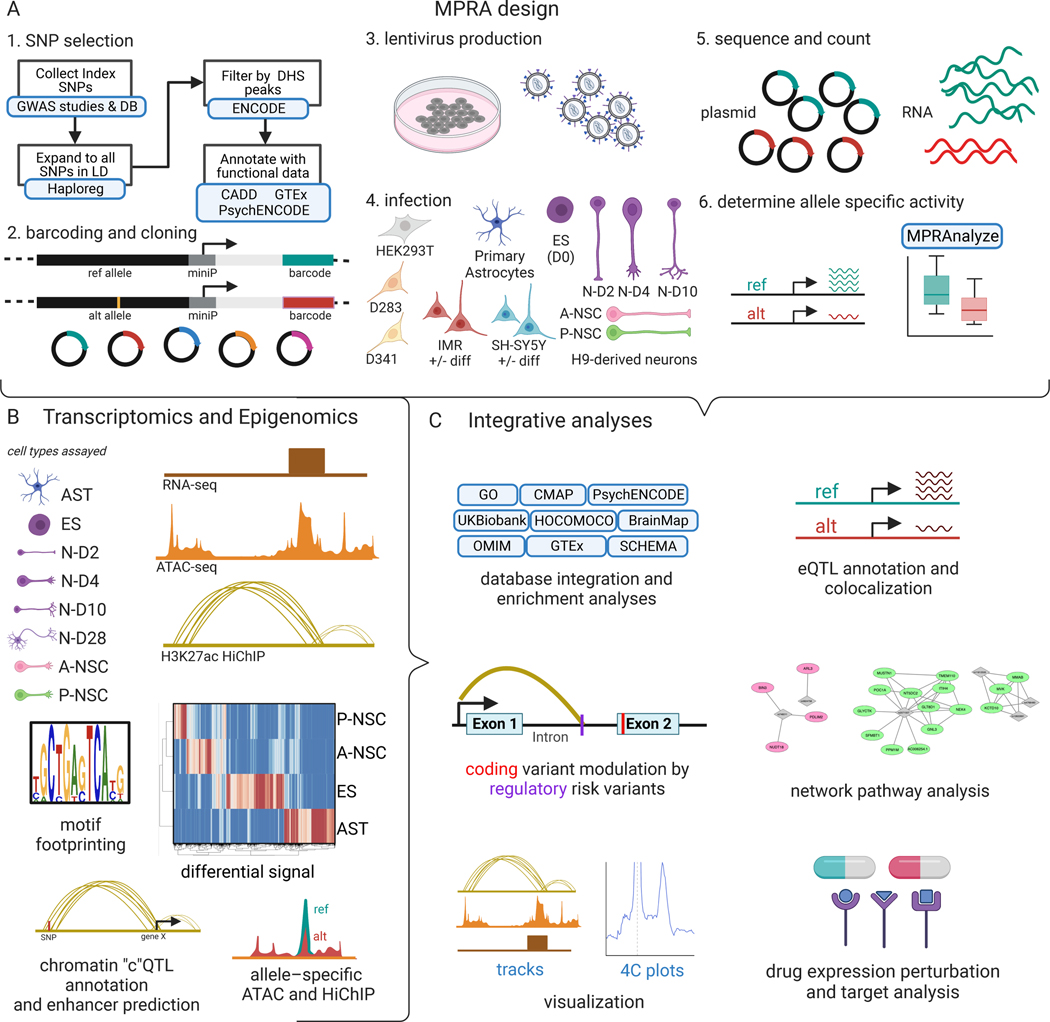
Fig. 1. MPRA, transcriptomic, and epigenomic integrative analyses for neuropsychiatric disorders.
(A) Schematic depicting lentiviral MPRA design for uncovering allelic specific activity. 250bp oligos were designed to assay 2221 neuropsychiatric disease GWAS loci. SNVs were selected from GWAS studies then filtered through publicly available epigenomics and eQTL datasets. H9 human ES cells, H9-derived neurons on days 2, 4 and 10 of differentiation (N-D2, N-D4, N-D10), anterior and posterior neural stem cells (A-NSC and P-NSC, respectively), astrocytes (AST), and cell lines (HEK293Ts, D283, D341, IMR-32 cells (+/− differentiation), and SH-SY5Y (+/− differentiation) were infected with the lentiviral MPRA library. (B) Schematic indicating the cell types in which RNA-seq, ATAC-seq, and HiChIP were performed as well as subsequent assay-specific analysis. Heatmap shows differential RNA-seq expression. (C) Analyses that integrate MPRA, transcriptomic, and epigenomic data to explore transcription regulatory pathomechanisms.
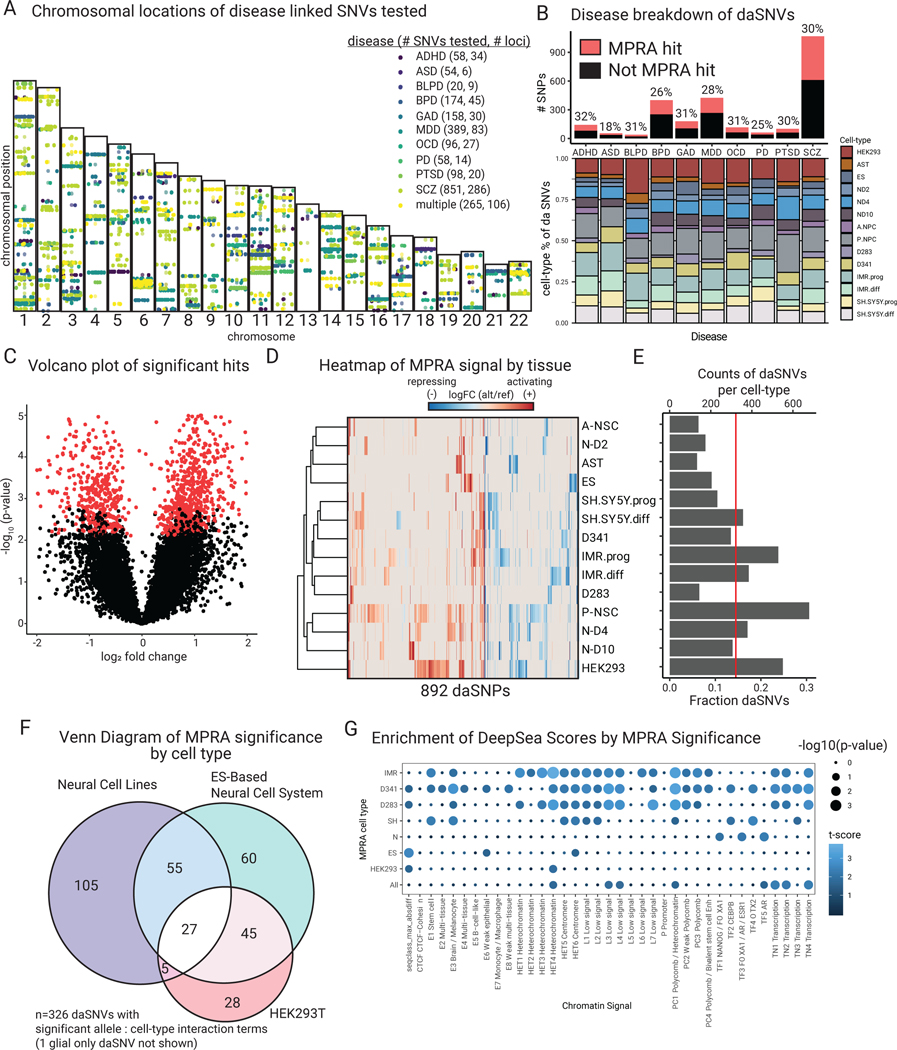
Fig. 2. MPRA identifies 892 functional daSNVs across 10 different neuropsychiatric diseases.
(A) Chromosomal map of locations of 2221 SNPs tested and their disease annotations (abbreviations: ADHD=attention-deficit hyperactivity disorder, ASD=autism spectrum disorder, BLPD=borderline personality disorder, BPD=bipolar disorder, GAD=generalized anxiety disorder, MDD=major depressive disorder, OCD=obsessive-compulsive disorder, PD=panic disorder; PTSD=post- traumatic stress disorder, SCZ=schizophrenia). (B) Barplot (above) indicating the fraction of assayed SNPs that were significant, separated by disease; ~30% of SNVs tested were deemed significant, with the exception of ASD, barplot (below) shows further distribution of daSNVs across cell types and conditions tested. (C) Volcano plot of -log10(p-value) vs log2 fold change indicating significant hits (red dots). (D) Heatmap of log2 fold change of alternative over reference allele activity captured by MPRA for the 892 significant hits. To the left, a row-based dendrogram of the heatmap shows relatedness of cell types and conditions by daSNV profile. To the right, (E) Barplot showing counts and fractions of daSNVs by cell-type, the red line shows the average fractions of daSNVs significant by cell-type = 0.145. (F) Venn diagram of the daSNVs showing significant cell-type dependent allelic activity (FDR<0.05) within neural cell lines, the ES-based neural cell system, and HEK293T (325 of the 326 significant variants are shown, as glial cells are not shown). (G) Dotplot showing enrichment of DeepSea Scores based on MPRA significance, where color is the -log10(p-value) and the size is the t-statistic for a two-sided Student T-test between the distribution of the allelic differential for the sequences scores classes for daSNVs vs non-daSNVs.
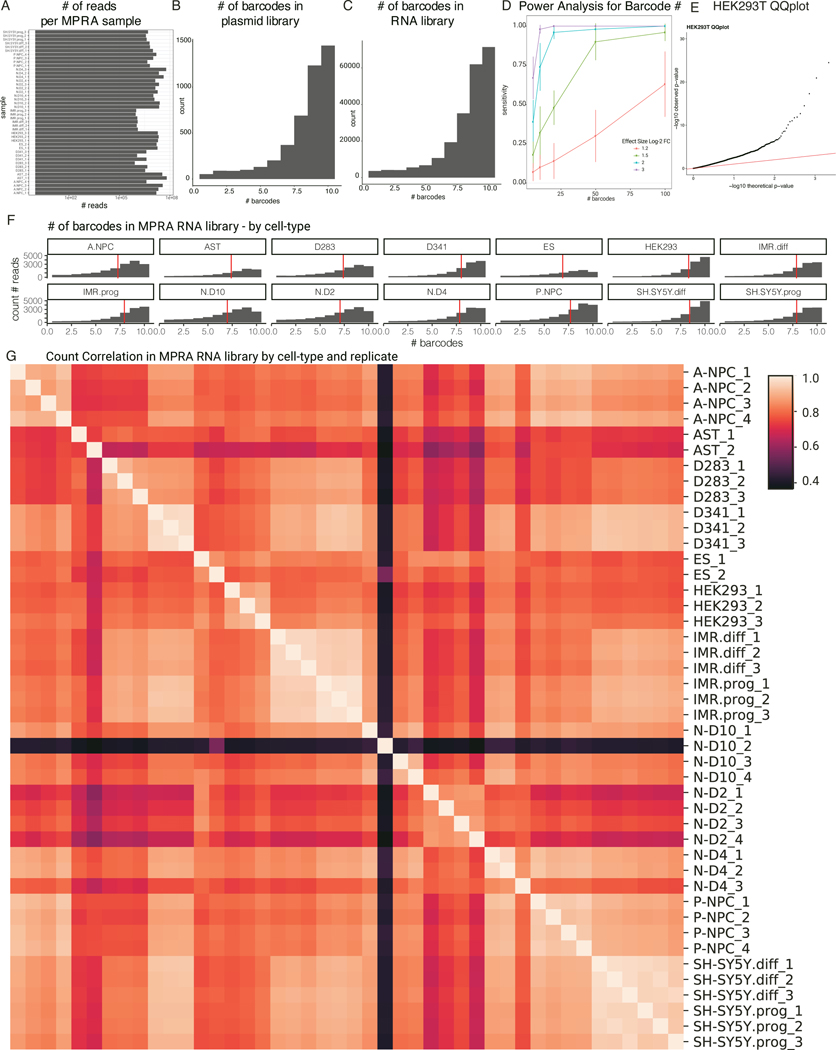
SNV function was assayed via MPRA in human H9 ES cells and their differentiated anterior and posterior neural stem cell progeny along with Neurogenin2-induced neuronal cells undergoing a previously defined maturation time-course14 to mimic features of neural development along with human astrocytes, and multiple cell lines, including the HEK293T epithelial kidney line used widely for MPRA, medulloblastoma cells lines D283 and D341, and neuroblastoma cell lines IMR-32 and SH-SY5Y. Per-replicate concordance in cell-extracted barcode codes from the resulting 44 independent MPRAs indicated robust data quality (Extended Data Fig. 1). 892 daSNVs (FDR < 0.05) with significant allelic activity differences in any of the cell types tested were found using a generalized linear model15. The validity of the model was confirmed with QQ plotting, which confirmed RNA counts followed a negative binomial distribution, whereas plasmid counts approximate a Poisson distribution (Extended Data Fig. 1E). Approximately 30% of variants were significant per disease; distribution of cell-type significance remained similar across diseases, with ~14.5% SNVs significant within each cell type and condition. HEK293Ts displayed a different pattern of allele specificity from other neural cell lines and the ES derived neural cells (Fig. 2A–E). A likelihood ratio F test model determined that 326 of 892 daSNVs had significant interaction terms between cell-type and allelic activity. Of the 187 daSNVs with significant cell-specific activity in human neural cells, only 72 overlap with those in HEK293T cells (Fig. 2F). GO term analysis of the nearest genes showed that ES-derived neural cell types and neural cell lines capture more neural-specific processes, such as “postsynapse organization” or “neural projection development”, compared to HEK293Ts. Additionally, neural cell-types displayed strong cell-type-dependent allele-specific activity in immunomodulation. Cell-type specific positive correlation was noted between the neuropsychiatric MPRA dataset and noncoding sequence-based variant predictive model, DeepSea16 (Fig. 2G, table S2). Neuropsychiatric genetic variants have cell-type specific activity at a DNA base pair scale not uncovered using conventional HEK293T cells.
RNA and chromatin dynamics in neural differentiation
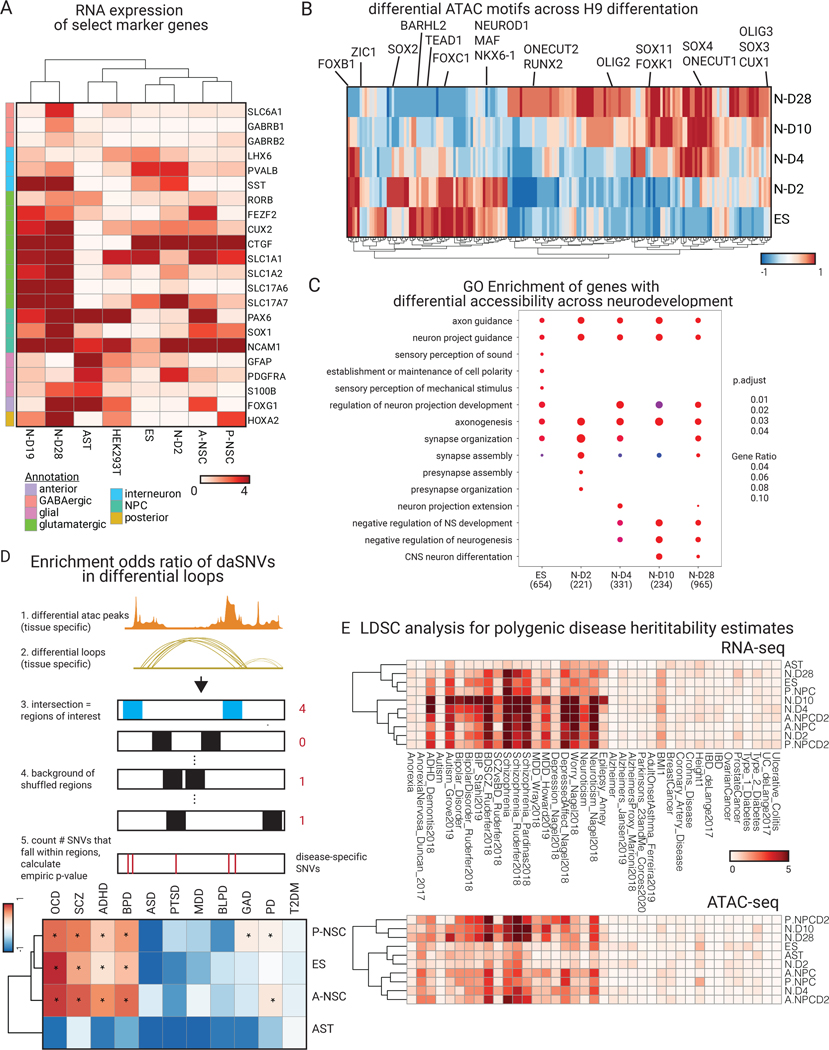
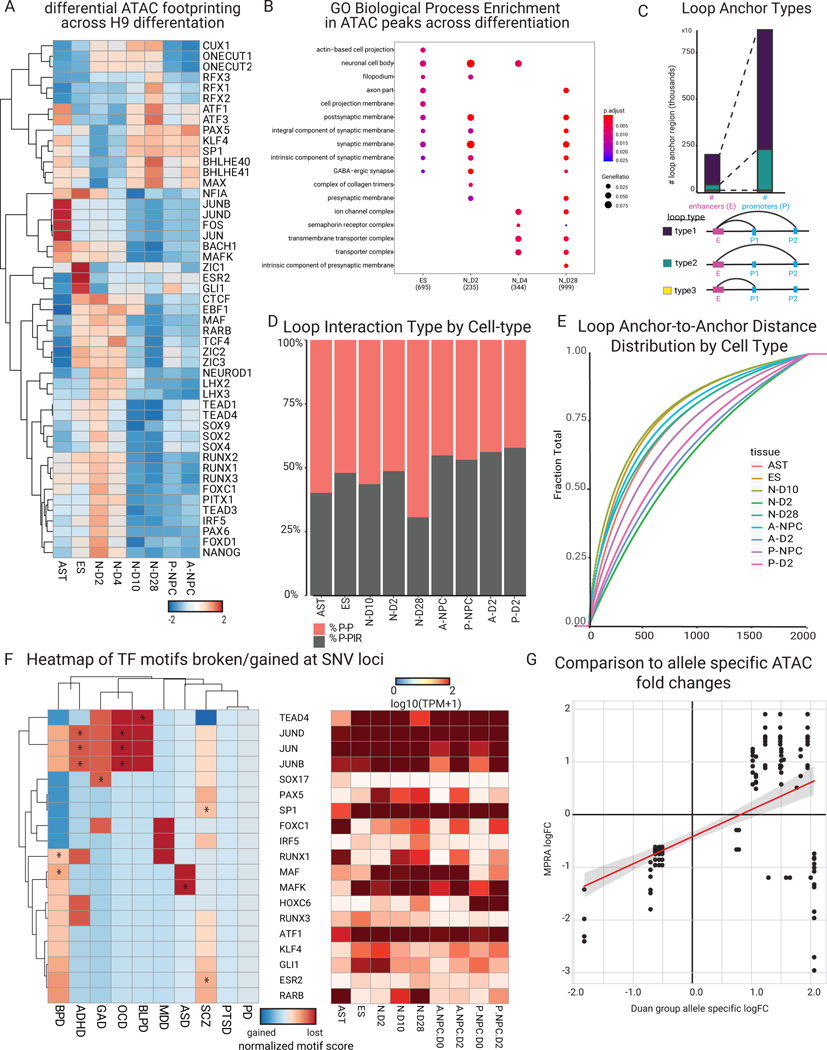
To place daSNVs in genomic context, matched RNA-seq, chromatin accessibility profiling via ATAC-seq17, and enhancer-promoter looping via H3K27ac HiChIP 18 was performed in ES cells and at days 2 (N-D2), 10 (N-D10), and 28 (N-D28) of neuronal differentiation, as well as anterior (A-NPC) and posterior (P-NPC) neuronal progenitor cells along with primary human astrocytes from adult brains (Fig. 1B, Fig. 3, Extended Data Fig. 2). Neurodevelopmental markers were observed in a cell type-specific fashion (Fig. 3A). Astrocyte markers (GFAP, PDGFRA, S100B) were preferentially expressed in primary astrocytes as was a glutamatergic specific marker (SLC1A1) in induced neurons. Anterior marker FOXG1 and posterior marker HOXA2 were seen in anterior neural progenitor cells (A-NPC) and posterior neural stem cells (P-NPC), respectively. GABAergic markers demonstrated lower expression in induced neurons, consistent with a primarily excitatory phenotype. Motif scanning of differential ATAC-accessibility profiles found transcription factor (TF) motifs clustered in two groups: early neuronal differentiation motifs (FOXB1, ZIC1, NEUROD1) and later neuronal differentiation motifs (CUX1, ONECUT1) (Fig. 3B–C). ATAC footprinting captured TF temporal dynamics (Extended Data Fig. 2). Processed H3K27ac HiChIP data extracted unique and shared regulatory DNA loops (Extended Data Fig. 2D–E, see Supplemental Methods for more details).The majority of putative enhancers were linked to promoters distal to the nearest gene (Extended Data Fig. 2C), as previously found19. Comparing these epigenomic datasets to published studies20–22 found strong overlap in accessibility profiles but less comparability for looping data due to differences in experimental methods (table S3 and S4). Additionally, comparative analysis between our daSNVs and allele specific open chromatin hits in Zhang, et al 202020 found overlapping significant variants (n=206) show moderate degree of positive correlation in log-fold changes (r2= 0.48, p-value = 1.7×10⁻¹³) (Extended Data Fig. 2G). Transcriptomic and epigenomic data provided an integrative view of cis-transcription regulatory modules and verified the phenotypes of neural cell populations studied.
Fig. 3. Epigenetic profiling of neural cell system shows neuropsychiatric disease relevance.
(A) RNA-seq expression heatmap of key marker genes for each cell type. FOXG1 and HOXA2 are expressed in our anterior and posterior neural stem cells, respectively. PDGFRA and GFAP are expressed in astrocytes. SLC glutamatergic gene markers are expressed at later stages of neuronal differentiation. (B) Heatmap of normalized motif occurrences in differential ATAC peaks over the time course of H9-derived neuronal differentiation. Motifs known to be more prominent in early neuronal differentiation (NEUROD1, ZIC1) are highlighted vs later neuronal differentiation (SOX11, CUX1). (C) GO biological process enrichment dot plot showing Benjamin-Hochberg-corrected p-values from two-sided hypergeometric tests for enrichment of genes found nearest to ATAC peaks within H9-derived cells across the temporal neuronal differentiation axis. (D) (above) a schematic of the GWAS tissue and disease-specific enrichment approach used (see Methods for more details) to derive a heatmap (below) of enrichment odds ratio of the daSNVs by disease over differential loop regions that were filtered by ATAC peaks. Type 2 diabetes mellitus (T2DM) was used as a control and indicated no enrichment. Enrichment was concentrated to the neuronal stem cells and the embryonic stem cell neuronal lineages (Data S1). (E) cell-type specific LDSC hereditability estimate negative log10(p-values) heatmaps for RNA-seq (above) and ATAC-seq (below) in the ES-derived neural cell system and relevant neural cell types.
The regulatory effects of neuropsychiatric disease variants were next explored. First, enrichment of the 892 MPRA-identified daSNVs within differential H3K27ac loops and accessible regions was quantified for each cell type (Fig. 3D, table S5). daSNVs for ADHD, BPD, PD, GAD, and SCZ were enriched in ES cells as well as in A-NPCs and P-NPCs, with no enrichment seen for control variants associated with type 2 diabetes risk. daSNVs were also not enriched in astrocyte differential loops and accessible regions, suggesting that neuropsychiatric disease pathogenesis may unfold primarily in neuronal cells. Second, allele-specific ATAC and H3K27ac HiChIP analysis found that daSNVs were infrequently associated with changes in DNA accessibility (2% of daSNVs) or looping (1% of daSNVs), suggesting that tested daSNVs do not mediate large changes in chromatin accessibility and structure. 268 daSNVs (30.0%) directly altered at least one known TF motif while 239 (26.8%) of daSNVs created at least one new TF motif (table S6). Interestingly, motif sequences for TFs that influence neuronal or glial differentiation, including AP-1 motifs23, SOX1724, and GLI125, were found significantly broken or gained at daSNVs in a disease-specific manner (Extended Data Fig. 2F, table S6B), suggesting that daSNVs act through altering local neural TF action rather than via larger scale impacts on chromatin architecture.
To ensure that the epigenomic and transcriptomic profiles used in these analyses are significantly enriched for regions capturing the genetic heritability 26–28 of neuropsychiatric disorders, linkage disequilibrium score regression (LDSC)29 was used to generate cell-specific heritability estimates using 25 neuropsychiatric GWAS. ATAC-seq based cell-specific annotations were derived using open chromatin profiles for 10 neural cell-types. Cell-specific heritability estimates were generated of neuropsychiatric diseases with ATAC-seq derived cell-specific annotations for 34 non-neural epithelial cells and cancer cell lines, as negative controls (Fig. 3E, Data S1). At Bonferroni-corrected p-value < 0.01 with respect to multiple hypothesis testing for each of the 44 cell-types, the epigenomic profiles of neural progenitor cells and later stage neurons were enriched for regions capturing the heritability of numerous neuropsychiatric GWAS, particularly for BPD, SCZ, MDD, and Neuroticism, unlike embryonic cells, astrocytes, epithelial and cancer cell lines. RNA-seq based cell-specific annotations were derived using gene expression profiles for 10 neural cell-types and cell-specific heritability estimates of neuropsychiatric diseases derived with RNA-seq derived cell-specific annotations for 16 non-neural epithelial cells and cancer cell lines, as negative controls. At Bonferroni-corrected p-value < 0.01 with respect to multiple hypothesis testing for each of the 26 cell-types, the transcriptomic profiles of embryonic cells, neural progenitor cells and neurons were enriched for regions capturing the heritability of numerous neuropsychiatric GWAS, particularly for ADHD, ASD, BPD, SCZ, MDD, Worry, and Neuroticism, unlike the astrocytes, epithelial and cancer cell lines. For additional negative controls, LDSC generated epigenomic and transcriptomic-based cell-specific heritability estimates using 19 GWAS for non-neuropsychiatric, complex diseases, none of which were significant. These analyses suggest the neural cells and corresponding open chromatin epigenomic and transcriptomic data used here are relevant cell-states to neuropsychiatric disease heritability.
Linking regulatory variants to genes and cell types
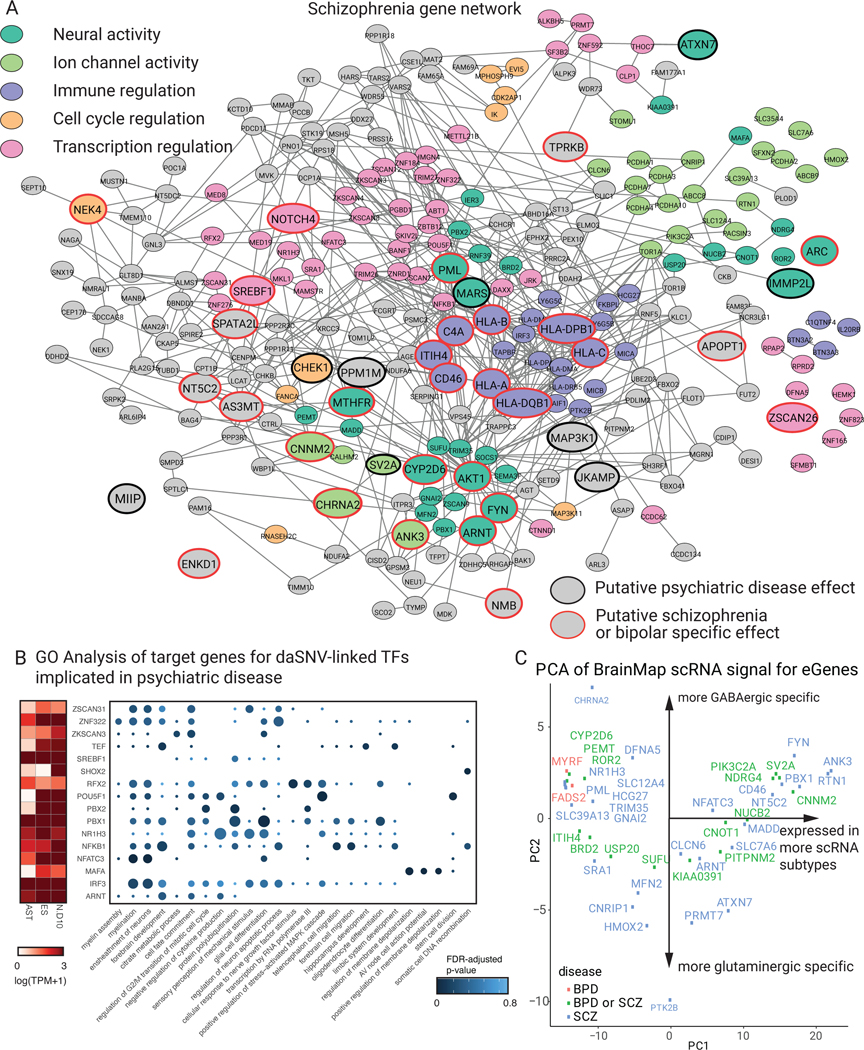
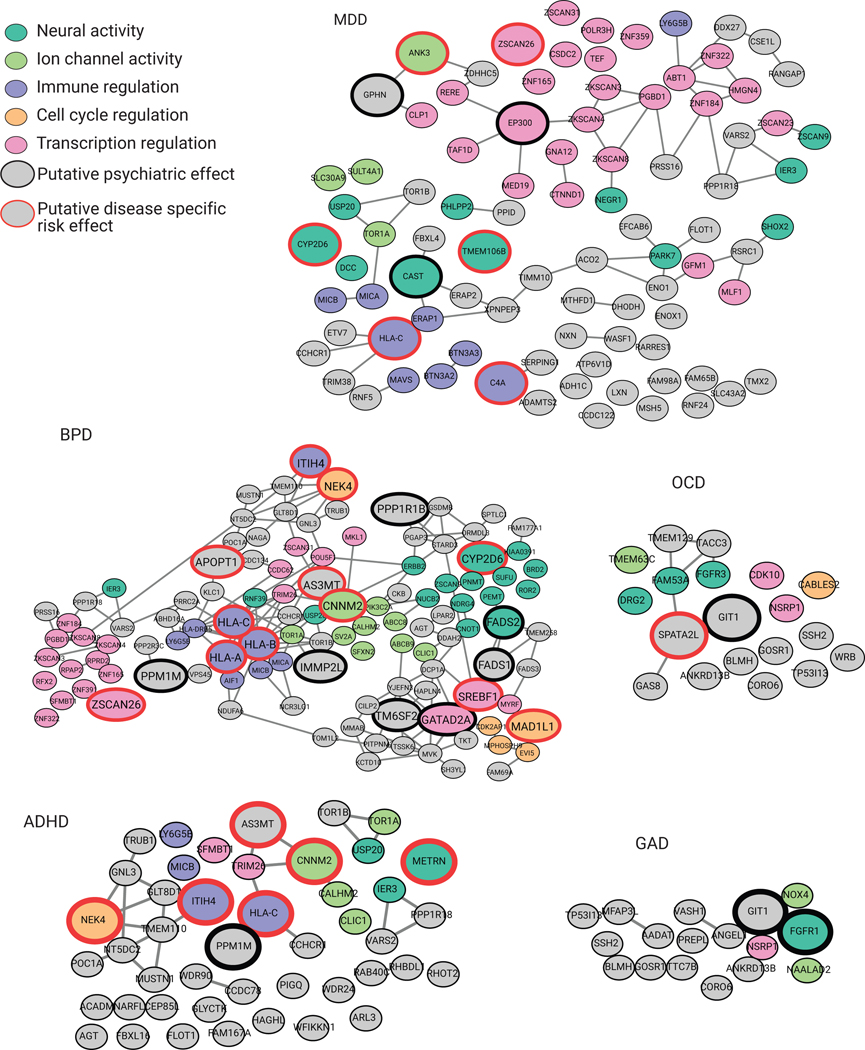
Brain-specific GTEx13 and PsychENCODE2,30 eQTL data were next used to link the 892 identified daSNVs to genes whose RNA expression varies with the variant’s presence (termed eGenes). 480 of the 892 daSNVs (approximately 67% of both the tested and significant SNVs) had eQTL-gene linkages where the gene was expressed in the neural cell model (TPM >1), with 641 putative eGenes were identified. Overlaying these 641 genes onto StringDB nominated protein interaction networks for each disease (Data S2). For SCZ, 447 genes across all cellular conditions were linked to eQTLs, annotated by protein function and disease-relevant automated literature search. A substantial portion of SCZ-linked candidate eGenes were associated with five main biological processes: ion channel activity, general neural processes, immune regulation, cell cycle regulation, and transcription regulation (Fig. 4A), providing a resource for hypothesis generation, components of which also touch on major proposed SCZ pathomechanisms1,31,32. For example, the immune hypothesis of schizophrenia31 was captured through genes connected to C4A and the HLA-C loci. eGenes involved in protocadherin function, Notch signaling33, and synaptic action via SV2A34, were also observed. Network analyses also identified potential pathomechanisms. For instance, SUFU maintains neuronal identity during corticogenesis35, however, its putative role in SCZ has not been defined. Of interest, there was not significant linkage between target gene biological processes and cell-type specific daSNV networks. BPD was linked to 176 putative eGenes, MDD to 128, ADHD to 67, GAD to 30, OCD to 27, BLPD to 24, PTSD to 17 (Extended Data Fig. 3). MPRA allele specific activity was confirmed via both episomal and lentiviral luciferase assays for selected daSNVs linked to target genes of interest (RERE, C4A/HLA-C, GIT1, PNMT) (table S7). <10 eGenes were nominated for ASD and PD; small numbers of daSNVs and putative eGenes correlated with fewer GWAS studies for these disorders. Putative eGene networks in MDD, GAD, OCD, and ADHD, however, consistently captured features of the same 5 biologic processes seen in SCZ, suggesting dysregulation of common shared biologic processes underpins multiple neuropsychiatric disorders.
Fig. 4. daSNV eGene networks and their transcription regulatory effects.
Protein-protein interaction network of eGenes assigned to (A) SCZ-associated daSNVs by GTEx and PsychEncode. Black outlined nodes were genes implicated in neuropsychiatric disorder disease risk based on an automated PubMed annotation pipeline; red outlined nodes were genes implicated specifically in SCZ. Nodes are color coded by neuropsychiatric-relevant functional process. (B) A dotplot depicting GO biological processes for target genes of TF daSNVs associated with neuropsychiatric diseases, where the color indicates FDR-adjusted two-sided p-value from hypergeometric test for enrichment, the size of the dot indicated geneset size, and is accompanied by an expression heatmap (left) showing log10(TPM+1) expression values for the TFs in neural relevant tissues assayed. (C) Scatter plot of principal component (PC) loadings for PC2 vs PC1, where loadings represent expression profiles from 127 cortical subtypes derived from Allen Brain Atlas scRNA-seq data, each point is an eGene. PC1 loadings correlate to expression of the gene in an increasing number of scRNA cortical subtypes. PC2 denotes the GABAergic vs glutaminergic cell type axis with CHRNA2 having a mostly GABAergic signature, while PTK2B has a mostly glutaminergic signature.
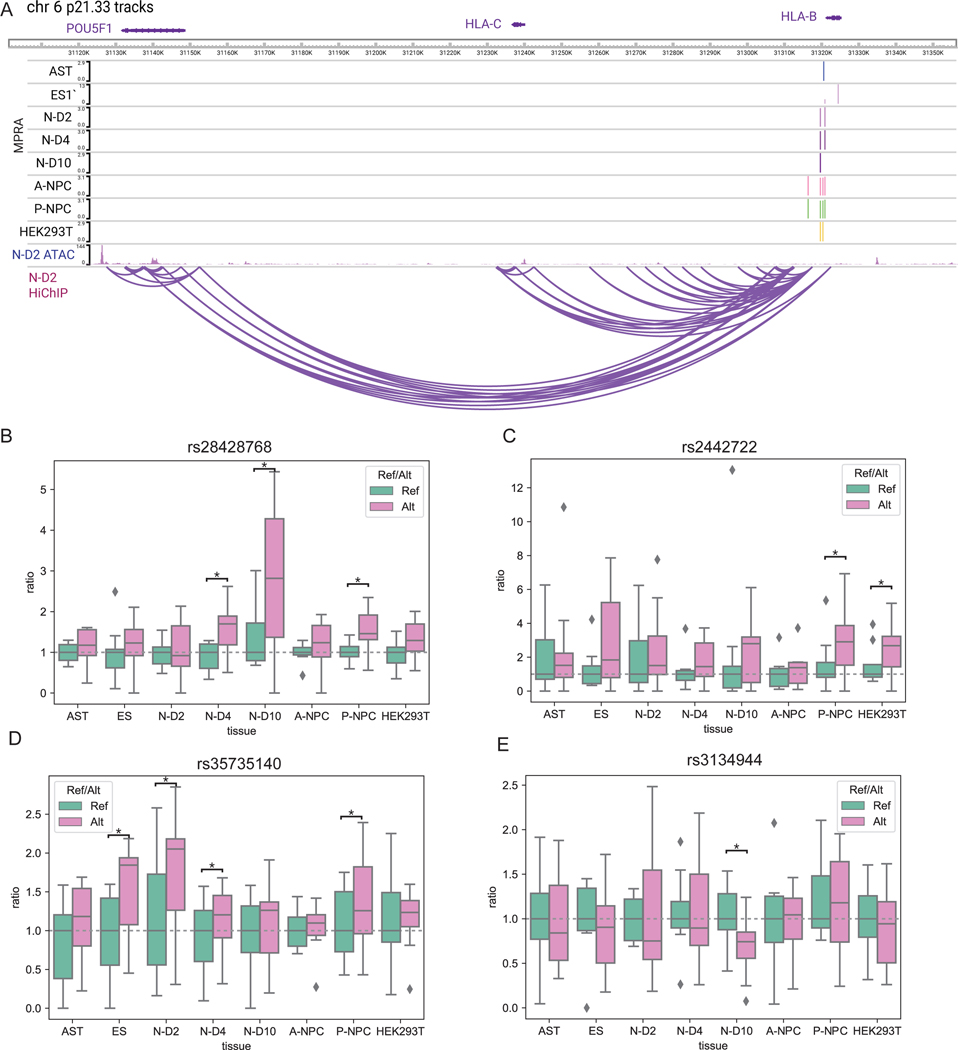
Transcriptional dysregulation, which can exert major impacts on neurodevelopment and homeostasis36, is one such process notably enriched in MPRA-significant networks versus networks extracted from non-significant MPRA hits. Furthermore, cis-target genes of daSNV-linked transcription factors may serve as potentiators for further downstream pathogenic effects on myelination, brain development, and membrane depolarization, among others (Fig. 4B). For example, 4 SCZ/BPD-linked daSNVs looped to the promoter for the POU5F1/OCT4 TF, which establishes a pluripotency-neural differentiation axis with SOX2 and PAX637; each of these daSNVs is a brain-specific eQTL. These daSNVs displayed different activities across neuronal differentiation. rs2442722 and rs35735140 showed allele specific activity early, in contrast to later differences seen with rs28428768 and rs3134944 (Extended Data Fig. 4), suggesting POU5F1/OCT4 dysregulation at different points in neuronal differentiation may confer differing levels of pathogenic risk. Studying daSNV activity dynamics in neuronal differentiation may shed light on stage-specific pathogenic mechanisms of transcriptional dysregulation.
To help place the 641 putative eGene targets of neuropsychiatric daSNVs in the human brain context, integrative analyses were performed with GTEx and single-cell RNA-seq data from the Allen Brain Atlas38. When daSNVs’ colocalization signals were stratified by GTEx tissue type, brain tissue types had significantly higher signal than non-brain tissue types, indicating daSNVs preferentially modulate transcription within the brain (table S8). Next, single-cell RNA-seq of cortical neurons were used to match putative eGenes to cell subtypes. PCA analysis across the 127 neuron expression profiles placed genes on a spectrum with two main considerations: number of cell types where a given gene was expressed and whether the gene was primarily found in GABAergic or glutaminergic cells. Putative daSNV eGenes expressed in more subtypes (i.e. CNNM2, ANK3, RTN1) may be involved in more global neuronal processes while certain genes were primarily expressed in GABAergic cells (CHRNA239) or in glutaminergic cells (PTK2B40) (Fig. 4C, table S9). scRNA and GTEx-based analyses map daSNV candidate eGenes to cell types within human brain.
Refining target genes and the CNNM2 magnesium transporter
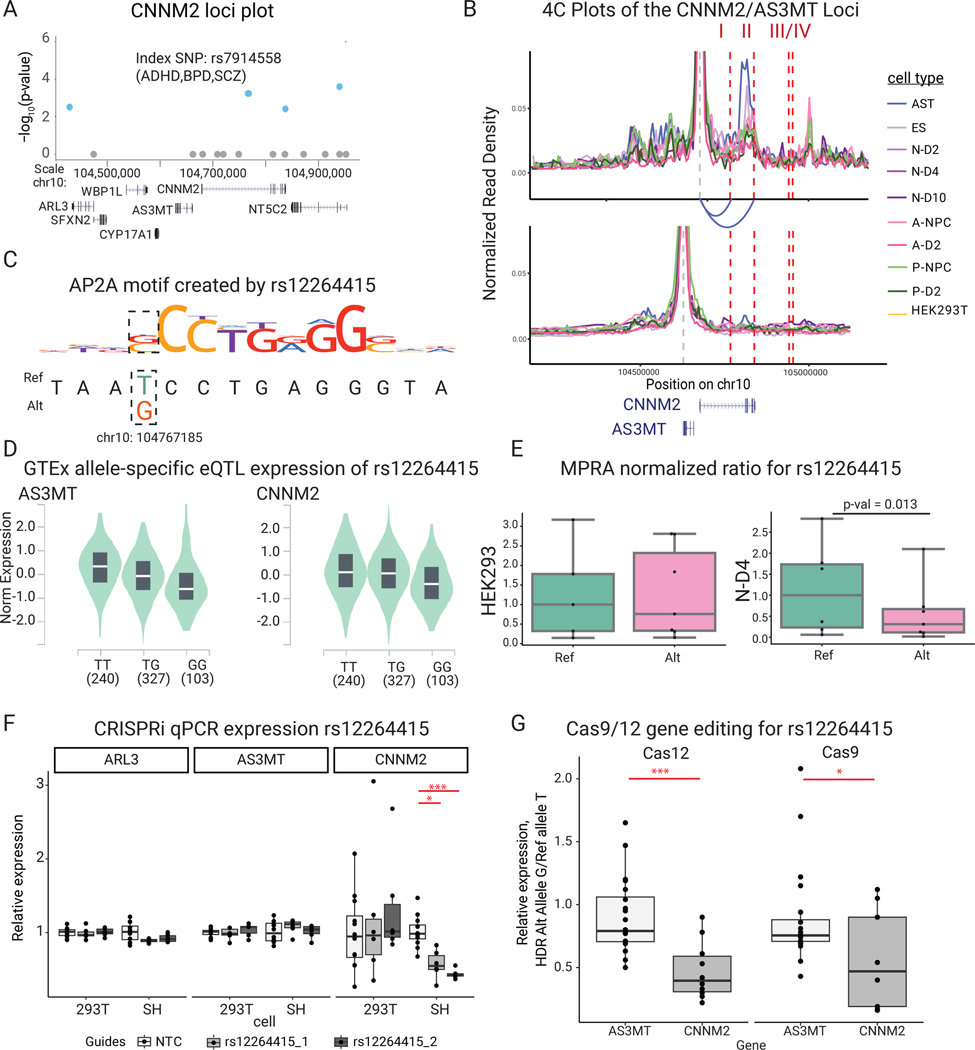
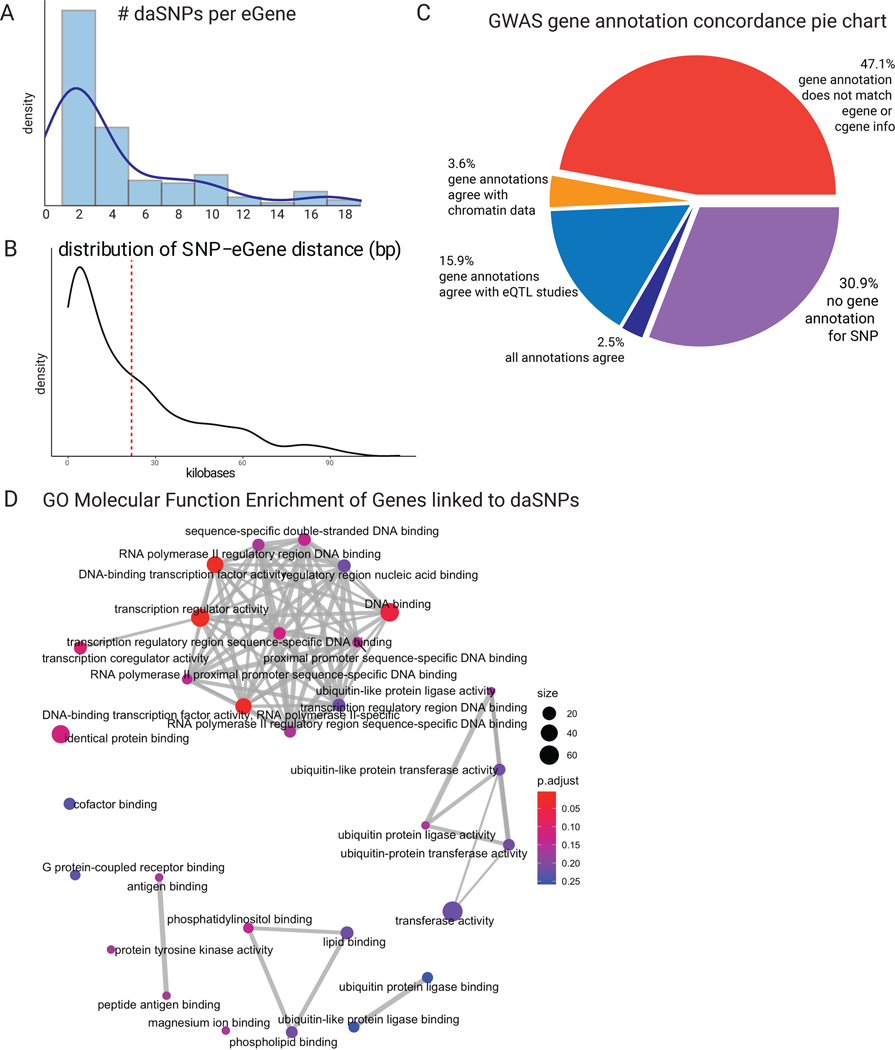
daSNVs’ impacts on local gene regulation were next studied by integrating eQTL analyses with chromatin accessibility and looping data. Focused analyses were necessary because an average of 5 daSNVs linked to each putative eGene, at an average distance of ~20kb. ~50% of GWAS gene annotations - typically annotated to the nearest gene - were discordant with eQTL or chromatin linkage (Extended Data Fig. 5), with minimal correlation between MPRA and GTEx effect sizes (Data S3), suggesting alternative epigenetic or environmental factors affect allele-specific activity. A distilled list of chromatin data-linked genes with eQTL support (Table 1, Data S3) was generated to nominate disease-linked putative eGenes. For example, the 10q24.32 locus (Fig. 5) containing CNNM2 magnesium transporter and AS3MT arsenic transporter genes is of interest because both have been previously associated with SCZ41,42. Although 4 daSNVs were annotated as eQTLs for the two genes in GTEx, only two daSNVs, rs12264415 and rs1046411, displayed local looping, as detected by H3K27ac HiChIP (Fig. 5B) in human neural cells. rs12264415 and rs1046411 both looped to the CNNM2 promoter. However, no daSNVs looped to the AS3MT promoter. rs12264415, which displays decreased transcription-directing activity with the risk/alternate G allele versus the protective/reference T allele, is of particular interest, as MPRA allele specific signal was only present in neurons and not in HEK293Ts (Fig. 5E). Transcriptional dysregulation by this daSNV was predicted to be due to an AP2A motif in the risk SNV (Fig. 5C). CRISPRi of rs12264415 (Fig. 5F), decreased CNNM2 mRNA in SH-SY5Y neural cells but not AS3MT or another adjacent gene, ARL3. Gene editing via both Cas12 and Cas9-based methods generated isogenic SH-SY5Y cells that differ only by a single nucleotide at the rs12264415 daSNV. The G disease risk SNV reduced CNNM2 mRNA expression to 43.8% of the T SNV by Cas12-based editing. Cas9 editing produced similar results, neither significantly impacted AS3MT expression (Fig. 5G). The disease-linked rs12264415 daSNV modulates expression of the CNNM2 magnesium transporter but not adjacent genes.
Table 1. daSNVs in neuropsychiatric diseases.
Selected daSNVs of the 892 significant hits. rsIDs of daSNVs and linked lead SNVs from GWAS data are listed, along with the odds ratio value reported in GWAS Catalog. If no odds ratio is given, a +/− modifier for the beta value is listed. Diseases implicated, MPRA cell type significant, daSNV average FDR-corrected p-value from MPRAnalyze’s likelihood ratio test, average log2 fold change (alternate/reference), HiChIP-derived genes linked to daSNVs by chromatin looping as well as eQTL-linked genes (eGenes) are shown.
| daSNP | Lead SNP | OR/Beta | Diseases | MPRA Cell Type | daSNP avg p-value | daSNP Avg Log2FC | HiChIP genes | eGenes |
|---|---|---|---|---|---|---|---|---|
|
| ||||||||
| rs3814546 | rs1182 | 1.06 | ADHD|BPD|MDD|SCZ | N | 1.4E-03 | 0.57 | C9orf78|TOR1A|TOR1B|USP20 | |
| rs2276834 | rs7618915,rs11717383,rs353547 | 1.06 | BPD|SCZ | HEK293T | 4.6E-05 | 1.10 | DNAH1|GLYCTK|GNL3|ITIH4|MUSTN1|NEK4|NT5DC2|PPM1M|SFMBT1|TMEM110 | |
| rs5996094 | rs1023500 | 1.08 | SCZ | N | 3.6E-04 | −0.77 | CCDC134|CYP2D6|DESI1|NAGA|TNFRSF13C | |
| rs139784051 | rs8044995 | 1.08 | SCZ | N | 5.7E-03 | 0.53 | CTRL|ELMO3|ENKD1|GFOD2|LCAT|NFATC3|PLA2G15|PRMT7|SLC12A4|TSNAXIP1 | |
| rs1985437 | rs8044995 | 1.08 | SCZ | AST|HEK293T|N | 1.0E-03 | 1.44 | CTRL|ELMO3|ENKD1|GFOD2|LCAT|PRMT7|RANBP10|SLC12A4|TSNAXIP1 | |
| rs2071507 | rs1042779,rs736408,rs4687552,rs2302417 | 1.1 | ADHD|BPD|SCZ | HEK293T|N|NCL | 2.6E-09 | −3.36 | AC006254.1|GLT8D1|GLYCTK|GNL3|ITIH4|MUSTN1|NEK4|NT5DC2|POC1A|PPM1M|SFMBT1|TMEM110 | |
| rs72708145 | rs140505938 | 1.1 | BPD|SCZ | N|NCL | 5.6E-03 | −0.56 | RPRD2|VPS45 | RPRD2|SV2A|VPS45 |
| rs1626899 | rs2102949,rs2851447 | 1.1 | BPD|SCZ | AST|N|NCL | 6.8E-04 | 1.27 | ABCB9|CDK2AP1|MPHOSPH9|PITPNM2 | ABCB9|AC026362.1|ARL6IP4|CCDC62|CDK2AP1|MPHOSPH9|MTRFR|OGFOD2|PITPNM2 |
| rs10786713 | rs7085104,rs11191424,rs11191419 | 1.11 | BPD|SCZ}ASD | HEK293T|N|NCL | 2.0E-03 | −0.91 | ARL3|AS3MT|SFXN2 | ACTR1A|ARL3|AS3MT|BORCS7|CALHM2|CNNM2|NT5C2|PFN1P11|SFXN2|SUFU|WBP1L |
| rs907088 | rs2517959 | 1.13 | BPD | AST|HEK293T|N | 8.5E-04 | −1.12 | ERBB2|GSDMB|ORMDL3|PGAP3|PNMT | ERBB2|FBXL20|GSDMB|ORMDL3|PGAP3|PNMT |
| rs174530 | rs174576,rs28456,rs174537,rs1535,rs174535,rs4246215 | 1.13 | BPD | N | 7.4E-04 | 0.77 | FADS1|FADS2|TMEM258 | FADS1|FADS2|FADS3|TMEM258 |
| rs903503 | rs2517959 | 1.13 | BPD | AST|N | 3.6E-04 | −1.08 | ERBB2|GSDMB|ORMDL3 | ERBB2|FBXL20|GSDMB|ORMDL3|PGAP3|PNMT |
| rs9266066 | rs2596500 | 1.18 | MDD|SCZ | HEK293T|N | 1.3E-03 | 0.75 | C4A|CCHCR1|FLOT1|HLA-C|IER3|LY6G5B|MICB|MSH5|NOTCH4|RNF5|VARS2 | C4A|CCHCR1|CYP21A1P|FLOT1|HCG22|HLA-C|IER3|LY6G5B|MICB|MSH5|NOTCH4|RNF5|VARS2 |
| rs174561 | rs28456,rs174576 | 1.18 | BPD | N|NCL | 1.6E-04 | −2.37 | FADS1|FADS3 | FADS1|FADS2|FADS3|TMEM258 |
| rs762995 | rs134882,rs2239612 | 1.22 | BPD|SCZ | N | 5.7E-04 | −0.71 | CCDC134|CYP2D6|DESI1|NAGA|NDUFA6 | |
| rs35525740 | rs7914558 | 1.22 | ADHD|BPD|SCZ | N | 2.5E-04 | −1.19 | ARL3|AS3MT|CALHM2|CNNM2 | ARL3|AS3MT|CALHM2|CNNM2 |
| rs12264415 | rs7914558 | 1.22 | ADHD|BPD|SCZ | AST|N|NCL | 5.7E-04 | 1.19 | ACTR1A|ARL3|AS3MT|BORCS7|CALHM2|CNNM2 | |
| rs200948 | rs1765142,rs34706883,rs112509803 | 1.24 | MDD|SCZ|BPD | HEK293T|N | 7.5E-04 | 3.07 | PRSS16|ZSCAN23|ZSCAN9 | PGBD1|PRSS16|ZKSCAN3|ZKSCAN8|ZNF165|ZSCAN23|ZSCAN26|ZSCAN31|ZSCAN9 |
| rs200483 | rs34706883 | 1.24 | MDD|SCZ | N|NCL | 1.8E-03 | −0.53 | PGBD1|ZSCAN23|ZSCAN31|ZSCAN9 | PGBD1|PRSS16|ZKSCAN3|ZNF165|ZSCAN23|ZSCAN26|ZSCAN31|ZSCAN9 |
| rs370155 | rs34706883,rs45509595 | 1.24 | MDD|SCZ|BPD | N|NCL | 8.5E-04 | −1.01 | PGBD1|PRSS16|ZKSCAN3|ZNF165|ZSCAN23|ZSCAN31 | PGBD1|PRSS16|ZKSCAN3|ZNF165|ZSCAN23|ZSCAN26|ZSCAN31|ZSCAN9 |
| rs2428682 | rs1985762 | 1.68 | BLPD | HEK293T|N|NCL | 1.5E-04 | −1.09 | EME1 | |
| rs3134944 | rs1800625 | 3.78 | SCZ | N | 2.9E-04 | 0.69 | AGER|C4A|CYP21A1P|FKBPL|HLA-B|HLA-C|HLA-DMA|HLA-DQB1|LY6G5B|MICB|NEU1|NOTCH4|PBX2|POU5F1|RNF5|SKIV2L|ZBTB12 | |
| rs10938176 | rs34215985 | 1.04 | MDD|BPD | AST|HEK293T | 2.5E-03 | −1.33 | SLC30A9 | |
| rs301807 | rs301806,rs301805,rs159963 | 0.03 unit desc | MDD | AST|N|NCL | 3.0E-08 | −1.38 | ENO1|RERE | |
| rs6926869 | rs6930781 | 0.46 unit incr | MDD | N | 7.3E-04 | −0.64 | WASF1 | |
| rs798744 | rs4818048 | 0.895 unit incr | OCD | HEK293T|N|NCL | 7.6E-04 | −1.85 | FAM53A|FGFR3|TACC3|TMEM129 | FAM53A|FGFR3|TACC3|TMEM129 |
| rs2799077 | rs853679 | 5.30 unit desc | MDD | N | 1.4E-03 | −0.72 | PGBD1|ZKSCAN3|ZKSCAN4|ZSCAN23|ZSCAN31 | PGBD1|ZKSCAN3|ZKSCAN4|ZKSCAN8|ZNF165|ZSCAN23|ZSCAN26|ZSCAN31 |
| rs4395073 | rs4785741 | 70.99 unit incr | OCD|ASD | N | 1.9E-03 | 1.02 | CDK10|GAS8|SPATA2L | CDK10|GAS8|SPATA2L |
Fig. 5. The CNNM2 magnesium transporter gene locus.
(A) SNV chromosomal maps for CNNM2 loci. Blue indicates daSNV is found to be allele-specific by MPRA, while size of the circle indicates MPRA logFC. Index SNP rsIDs are listed. We note that rs7914558 corresponds to the daSNV rs12264415 (B) CNNM2 (above) and AS3MT (below) H3K27ac HiChIP 4C plots depicting looping to respective gene, color coded by cell type. Red dashed lines indicate SNVs that are eQTLs for CNNM2 in GTEx: I= rs12264415, II= rs1046411, III=rs35525740, IV=rs1141095. Loops are present between SNVs I and II to CNNM2 but not to AS3MT. (C) Motif PWM analysis showing putative AP2A motif formation SNV rs12264415. (D) GTEx allele-specific normalized expression violin plots for AS3MT and CNNM2 for eQTL rs12264415 in whole blood. In the violin plots, center line represents median, box edges represent upper and lower quartiles, and distribution is derived from all relevant tissues samples on GTEx Portal. (E) Box-and-whisker plot showing normalized MPRA counts ratios for reference (teal) to alternate (orange) allele for rs12264415 in HEK293T and N-D2 tissues. Ratios are normalized to the median reference allele values, where the center line is the median of each MPRA normalized ratio (each point is a genomic instance with at least one count, max n=5 and 6, for HEK293T ref or alt respectively; and n=6,7 for N-D4 ref or alt, respectively). FDR-corrected p-values were calculated using MPRAAnalyze’s likelihood ratio test, show there is a significant allele specific activity in N-D2 (p= 0.013) but not in HEK293Ts (p=0.88). (F) CRISPRi box-and-whisker plot showing relative qPCR expression of ARL3, AS3MT, CNNM2 at rs12264415 loci in both HEK293s and SHSY5Y cells. P-values are calculated from two-sided Student T-tests with * indicating p-value=8.6e-4 and *** indicating p-value=4.0e-7 for n=6 biological replicates. (G) Box-and-whisker plots showing relative Cas12 (left) and Cas9 (right)-based gene editing expression of allele G (alternate) vs allele T (reference) at the rs12264415 loci. * indicates two-sided Student t-test p= 0.036, *** indicates p=6.9e-4. n=5 biological replicates. All box-and-whisker subplots in this figure are shown with a maximum whisker length of 1.5*IQR. The center line represents the median; the box edges represent the upper and lower quartiles. All outliers are shown.
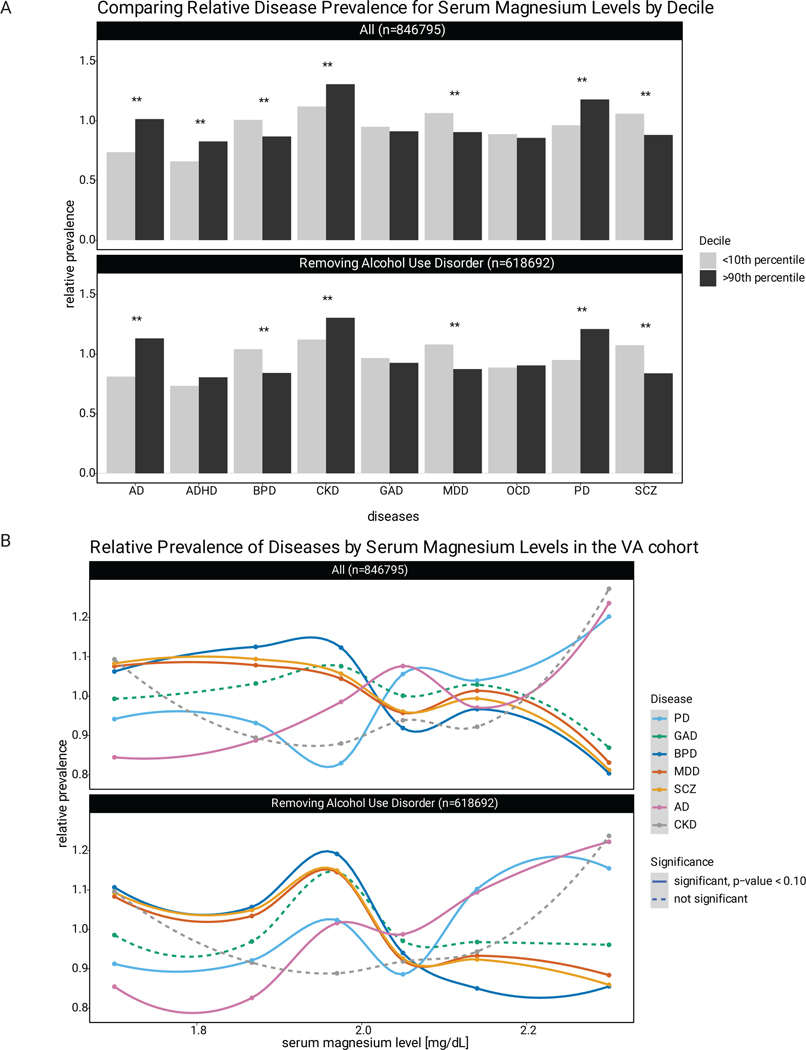
In humans, mutations in CNNM2 are strongly linked to hypomagnesemia, leading to seizures and impaired brain development.41,43 The association between magnesium and neuropsychiatric disease was therefore assessed using a 846,795 person cohort from the Department of Veteran’s Affairs. An inverse relationship was observed between the prevalence of SCZ, MDD, and BPD and serum magnesium levels. This was not seen for other neurologic disorders, such as Alzheimer’s dementia. These trends held, when removing patients with alcohol use disorder, a possible confounder of the relationship between disease prevalence and magnesium levels. A significant difference was observed between relative disease prevalence between the bottom 10th and upper 10th deciles of serum magnesium (Extended Data Fig. 6). Integration of laboratory data with clinical diagnoses suggests that decreased magnesium correlates with an increased prevalence of specific neuropsychiatric disorders.
Noncoding regulatory risk and large effect size variants
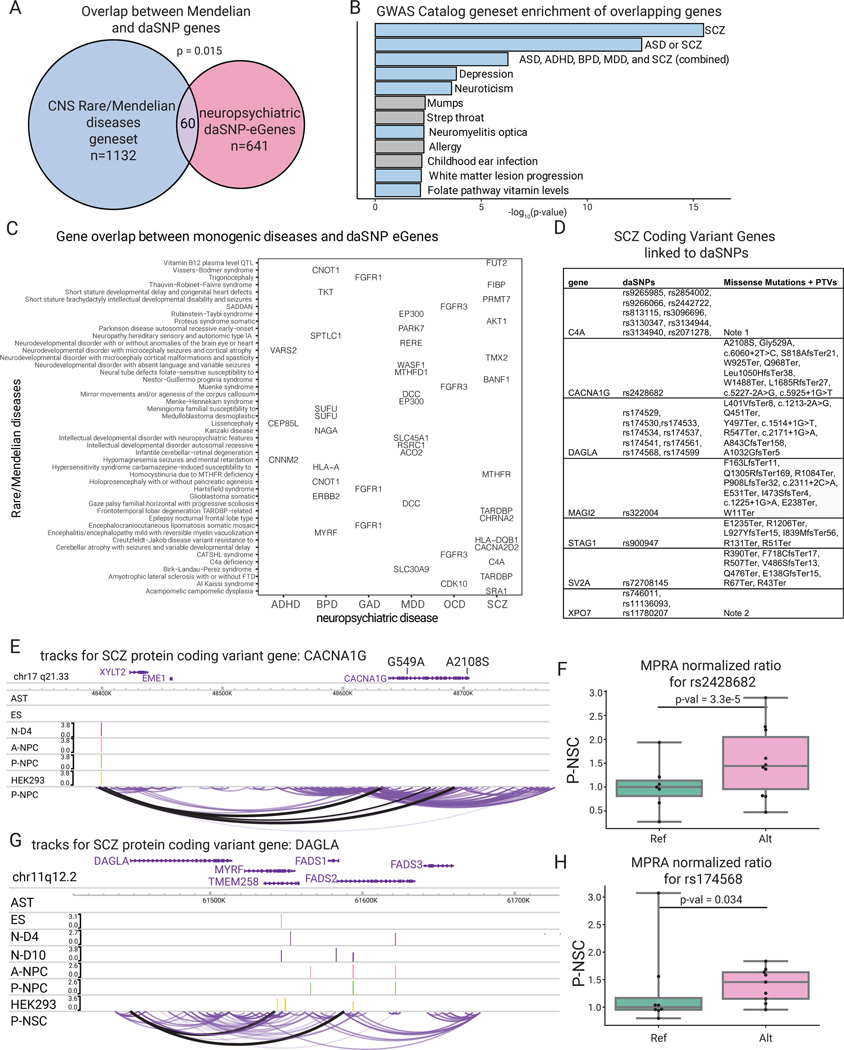
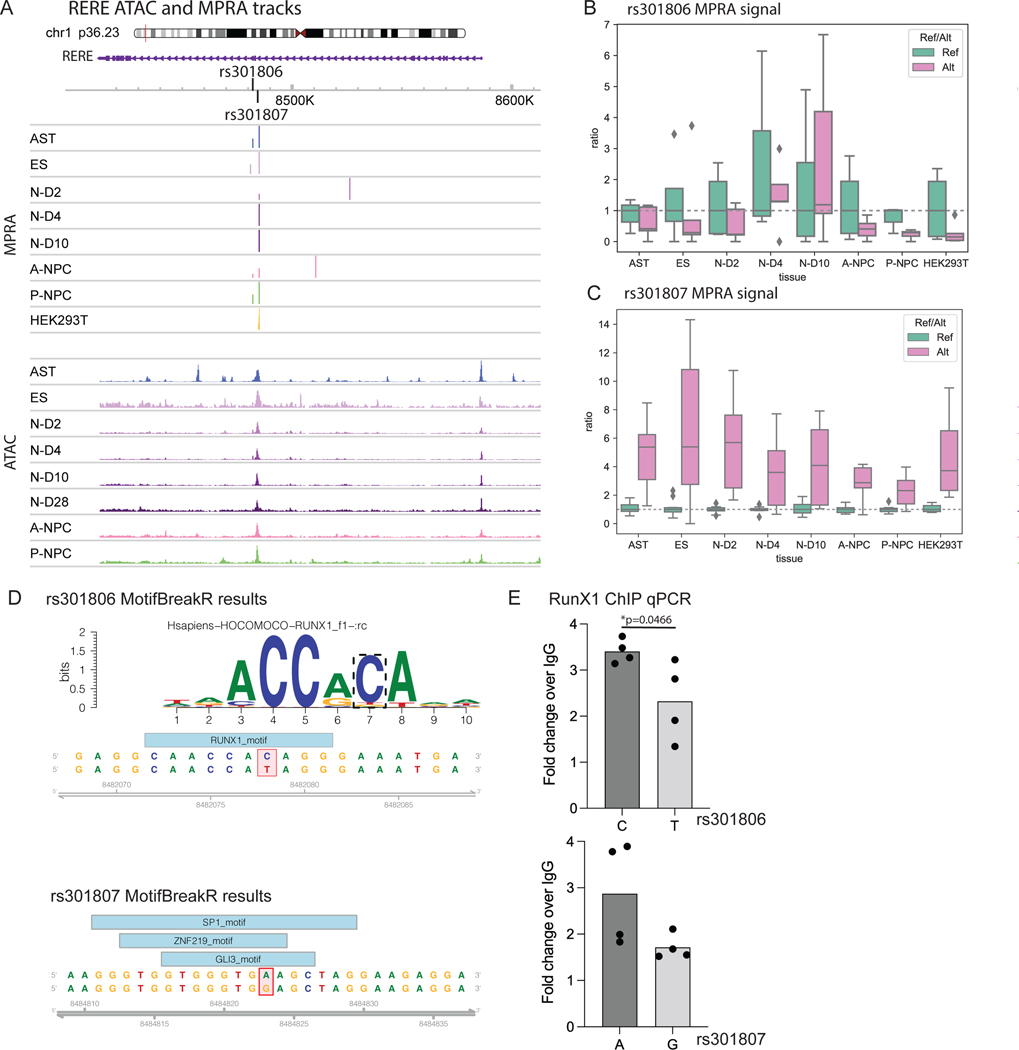
To further integrate daSNVs into the architecture of polygenic neuropsychiatric disease risk and to nominate pathomechanisms supported by orthogonal lines of evidence, analyses with larger effect size protein coding variants were performed. The latter include coding genes whose mutation leads to Mendelian central nervous system (CNS) diseases as well as rare coding variants identified in neuropsychiatric disease risk. 60 daSNV eGenes were found to be mutated in Mendelian CNS diseases (Fig. 6A–B), a significant enrichment consistent with the premise that regulatory variants produce less extreme pathologic impacts than coding mutations. For example, in the matrix of overlapping daSNV eGenes with Mendelian CNS disorder genes (Fig. 6C) is the RERE gene, whose deletion impairs human neurodevelopment via decreased cortical thickness44,45. RERE is a putative eGene linked to the rs301806 daSNV in MDD, suggesting a link between RERE-dependent neurodevelopmental processes and risk for major depression. In this regard, rs301806 disrupted the DNA binding motif for RUNX1, a TF with essential roles in neural differentiation46 and also decreased MPRA signal in early neuronal differentiation. Episomal ChIP-PCR for RUNX1 demonstrated differential binding of RUNX1 for rs301806 (Extended Data Fig. 7). This MDD-linked daSNV may thus impact neurodevelopmental pathways by altering TF binding and subsequent expression of RERE, supporting the rationale for systemic studies of daSNVs’ action as eQTLs for genes whose coding mutations produce Mendelian disorders of the CNS.
Fig. 6. Altered coding genes in CNS diseases inform risk in psychiatric disorders.
(A) Venn diagram depicting overlap between Mendelian CNS disease genes and the neuropsychiatric eGenes linked to daSNVs; p-value=hypergeometric test between the two gene sets over a background of all potential disease-associated genes (n=15999 possible Mendelian genes). (B) Gene set enrichment analysis calculated by EnrichR with Benjamin-Hochberg corrected p-value from a two-sided hypergeometric test for the 2019 GWAS Catalog of the 60 overlapping genes, where the blue bars indicate diseases of neuropsychiatric etiology or linkage. (C) Grid chart of genes in the intersection between rare/Mendelian diseases and the neuropsychiatric diseases. (D) Abbreviated table of SCZ Coding Variant Genes linked to chromatin data (see also table S1). (E) Tracks for CACNA1G, where the peak tracks show the logFC change from cell-type specific MPRA for the daSNVs, and the bottom loop track shows the looping data for P-NPC cell type, indicating the daSNV rs2428682 loops to the promoter of CACNA1G. Scales are only included if there was a peak within the given region shown. (F) Box-and-whisker plot showing normalized MPRA counts ratios for reference (green) to alternate (pink) allele for rs2428682 in P-NPC, where the center line is the median of each MPRA normalized ratio (each point is a genomic barcode instance with at least one count, n=7 for Ref, n=10 Alt), box limits are the upper and lower quartiles, whiskers are the 1.5x interquartile range, and points shown are outliers. Ratios are normalized to the median reference allele values. FDR-corrected p-values were calculated using MPRAnalyze’s likelihood ratio test indicate significant allele specific activity (p=3.3e-5). (G) Similar track for coding variant gene DAGLA. (H) Box-and-whisker plot showing normalized MPRA ratios for one of the daSNVs linked to DAGLA, rs174568, where each point is a barcode (n=8 for Ref, n=9 for Alt). All boxplots shown have a maximum whisker length of 1.5*IQR. The center line represents the median; the box edges represent the upper and lower quartiles. All outliers are shown. FDR-corrected p-values were calculated using MPRAnalyze’s likelihood ratio test indicate significant allele specific activity (p=0.034)
The overlap between daSNV eGenes and rare coding variants identified by neuropsychiatric disease GWAS was next explored. Genes found mutated in large-scale exome sequencing from the Schizophrenia Exome Sequencing Meta-analysis (SCHEMA) consortium47 were intersected with genes linked to daSNVs via neural cell chromatin architecture (n=7 genes; C4A, CACNA1G, DAGLA, MAGI2, STAF1, SV2A, XPO7) (Fig. 6D–G, table S10). For example, promoters for protein coding variant genes identified in SCZ exome sequencing, including CACNA1G and DAGLA, were in physical contact with rs2428682 and rs174568 daSNVs, respectively (Fig. 6E–H). Given that SCHEMA-prioritized protein variants of CACNA1G contribute to SCZ risk - potentially by dysregulating calcium influx during neural action potentials, which in turn may disrupt neurotransmitter release and neural circuitry important in disease risk48 - noncoding variants with small effect sizes altering CACNA1G expression may exert similar impacts. These findings are consistent with the premise that regulatory daSNVs may pathogenically alter expression of the same genes whose coding mutations exert large effect size impacts on neuropsychiatric disorders.
Determining shared symptom manifestations of regulatory risk
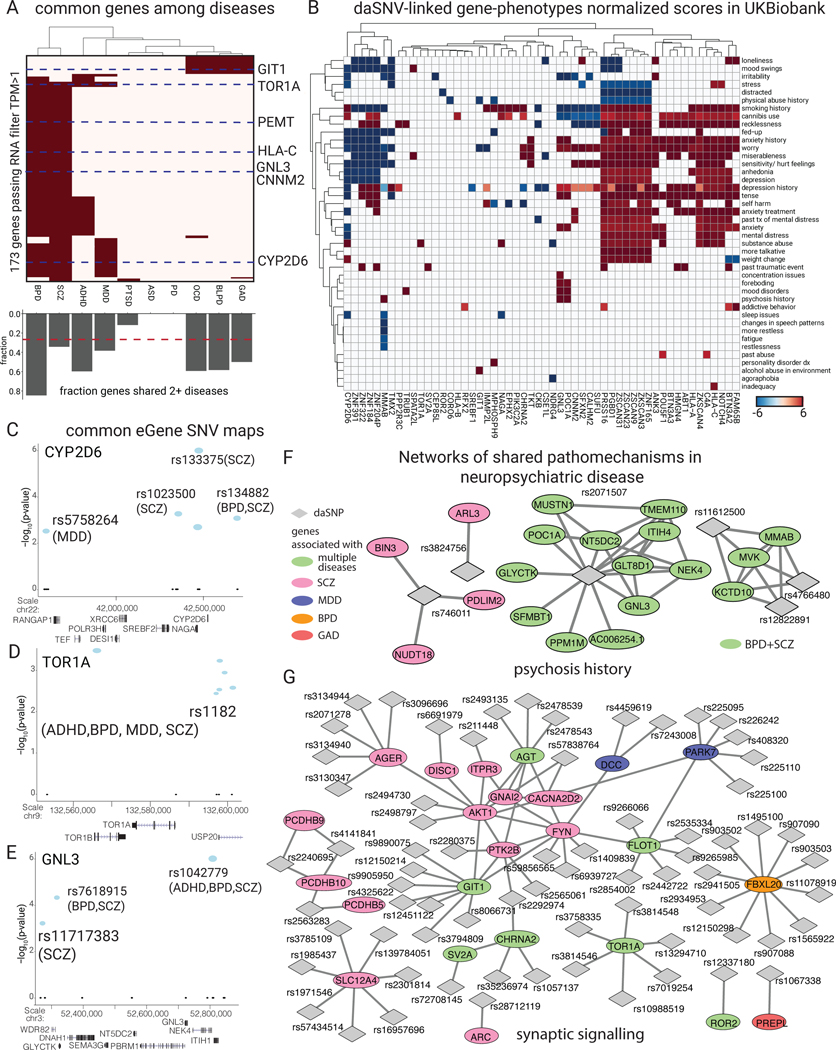
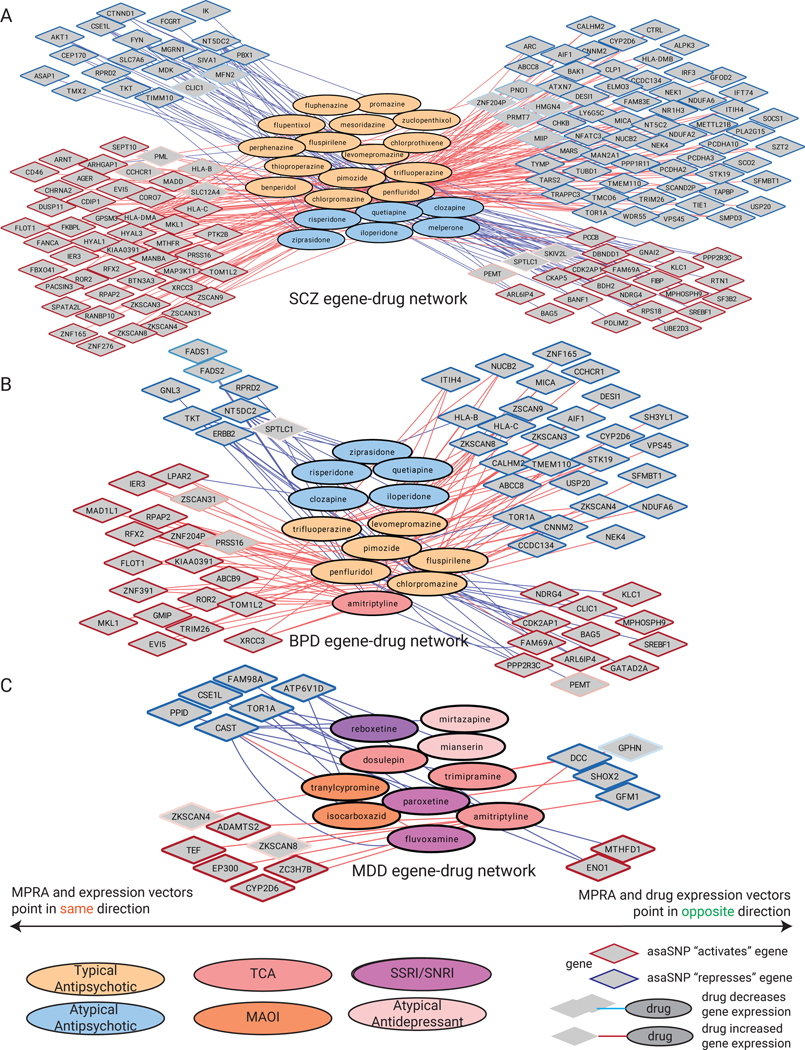
Neuropsychiatric diseases are diagnosed based on constellations of clinical symptoms. Many symptoms are shared among disorders, suggesting they may reflect common genetic bases. Consistent with this, 192 of 641 daSNV-linked candidate eGenes (30.0%) were shared between at least two disorders. BPD and BPLD had the highest fraction of their eGenes shared with at least one other disease, suggesting they arise via dysregulated biologic processes impacted in multiple conditions (Fig. 7A). eGenes were associated with 806 psychiatric disease symptom codes derived from UK Biobank GWAS summary statistics49, clustered into 64 annotated phenotypes based on gene profile, and normalized for gene-symptom relationships (Fig. 7B). To avoid over-annotation of individual daSNVs, loci containing multiple disease genes were collapsed to show only one gene per locus, based on prioritization schema favoring genes with brain-specific expression modulated by, chromatin linkage to, and prior literature evidence for, the given daSNV. Anxiety-relevant symptoms such as worry, tenseness, and stress were enriched in inflammatory daSNV eGenes around the C4A and HLA-C locus. Interestingly, CYP2D6, a cytochrome P450 enzyme with a compound metabolizing role in CNS, displayed protective gene-trait effects for anxiety-related symptoms, indicating the potential for therapeutic targeting. Further supporting this, known therapeutics were linked to putative eGenes via connectivity map (CMAP)50 perturbation analysis (Extended Data Fig. 8), highlighting 8 daSNV-linked genes, including SV2A, AP3B2, and ARC, as higher priority drug targets (table S11 for full list of prioritized drug targets). GNL3 and POC1A genes were linked to another clinical feature, psychosis history. Together, these gene-phenotype associations identify potential shared molecular bases for individual neuropsychiatric symptoms.
Fig. 7. daSNV-eGene-symptom linkage in neuropsychiatric disorders.
(A) eGene (row) by disease binary heatmap where red indicates one of the 173 putative daSNV eGenes associated with at least 2 diseases and expressed in the corresponding cell type with TPM > 1. Heatmap clusters BPD and SCZ eGenes as being the most similar. Below the heatmap, a bar chart displaying fraction of eGenes shared between two or more diseases is shown. The red dashed line indicates that 26.8% (173 out of 641 eGenes) overall are shared between ≥2 diseases. (B) UK Biobank PheWAS analysis shown as a heatmap of mean normalized beta values for UK Biobank neuropsychiatric symptoms across conditions for the different eGenes. eGenes are clustered by chromosomal location. daSNV chromosomal maps of example common eGenes: (C) CYP2D6 (D) TOR1A and (E) GNL3 implicated in multiple diseases with ≥1 index SNVs directed from literature or GWAS. Blue indicates daSNV found to be allele-specific by MPRA, while size of the circle indicates the absolute value of the MPRA log2 fold change (alternate/reference). (F) daSNV (diamond) - gene (ellipses) networks of shared pathomechanisms in neuropsychiatric disease. Network of daSNV-eGene candidates implicated in psychosis history were derived from UK Biobank, where green ellipses are genes shared between BPD and SCZ, while pink nodes are SCZ only. (G) is the network of daSNV-eGene candidates implicated in the GO biological process synaptic signaling. Genes are color coded by disease of origin, where the green circles represent implicated genes shared between multiple diseases. Genes are linked via StringDB v11.
Gene-phenotype associations were further examined for clues to molecular etiology of shared pathomechanisms underlying common neuropsychiatric symptoms. Loci maps were created at known MPRA daSNV “hotspots” CYP2D6, TOR1A, GNL3, HLA-C, and GIT1 (Fig. 7C–E), to determine the interplay between daSNVs associated with multiple disorders. Three general structures were observed: one where a single GWAS lead SNV was associated with multiple disorders (TOR1A), another where multiple disorders shared multiple SNVs at a given locus (GIT1), and most commonly, where individual diseases have different sets of associated SNVs (CYP2D2, HLA-C, CNNM2, GNL3, RERE) that modulate the same set of genes. This pattern was further defined by generating daSNV-gene networks surrounding shared clinical features and biological processes, such as psychosis history (Fig. 7F), synaptic signaling (Fig. 7G), regulation of cytokine production, sleep issues, anhedonia, and irritability (Data S4). For psychosis history, pertinent for SCZ and BPD, the latter two diseases shared daSNVs at loci surrounding the gene for GNL3, a brain-expressed G protein important for stem cell proliferation and differentiation51, and for KCTD10, a brain-expressed protein mediating tetramerization of voltage-gated potassium channel subunits52. Both loci may have putative linkages to psychosis in multiple disorders53,54. SCZ also displayed two additional daSNVs relevant for psychoses, namely rs746011 and rs3824756. Similar observations were made in synaptic signaling, which was linked to daSNVs in 4 different diseases. These data suggest that common genetic pathomechanisms mediate symptomology shared across multiple neuropsychiatric diseases.
Discussion
We explored the genetic contributions of noncoding SNVs to neuropsychiatric disease by integrating MPRA with epigenomic profiling in human neural stem cells, differentiating human neurons, neural cell lines, and primary astrocytes and thereby generated a multi-disorder, single nucleotide compendium of 892 functional daSNVs in regulatory DNA linked to risk for 10 neuropsychiatric diseases. Altered transcription-directing activity of these daSNVs was not associated with major impacts on chromatin accessibility and looping, suggesting action via other mechanisms, such as modifying TF binding, as observed for RUNX1 at rs301806. Network analyses linking daSNVs to putative eGenes demonstrated that disease-centric gene networks recurrently implicate several biologic processes in neuropsychiatric disease: namely ion channel disruption (in particularly calcium, potassium, chloride, and magnesium channels), modulation of neuronal proliferation (including genes such as NEK4 and GNL3), protocadherin function, Notch signaling, synaptic action via SV2A, and immune activity (particularly MHC and C4 complement families). Chromatin and expression linkages suggested that neuropsychiatric disease pathogenesis unfolds primarily in neuronal cells, highlighted disease-linked eGenes, such as POU5F1, CNNM2, and RERE, and mapped putative disease eGenes to native brain cortical subpopulations.
CRISPRi and gene editing demonstrated that specific neuropsychiatric risk-linked daSNVs modulate expression of the CNNM2 gene. The CNNM2 transporter is important in magnesium homeostasis. Consistent with a role for magnesium in neuropsychiatric disorders are its known roles in neuronal development, transmission, and survival as are reports of its use as an off-label supplement for depression.55 The relative impacts of altered magnesium levels and transport in the brain versus total magnesium body stores and the potential impact of magnesium supplementation on the prevention and treatment of neuropsychiatric disease is of interest for further study.
MPRA during neuronal differentiation helped identify functional daSNVs that may contribute to an interplay between neurodevelopmental milestones and neuropsychiatric disease risk—as observed here in early neuronal differentiation for the MDD-linked RERE eGene. Tissue-specific diseases have cell-type specific pathomechanisms. However, prior large-scale MPRA studies of human regulatory variants were conducted in transformed cell lines, such as HEK293T and K562 cells, that may not reflect a disease-relevant gene regulatory milieu. Consistent with this, HEK293T cells failed to detect the majority of functional daSNV alleles in this study. Overlap between SNVs studied here and other datasets20–22,56 was low, however, rs214469 was studied by MyInt, et al. 202056 with concordant directionality in allelic activity in the neural cell type (SH-SY5Y) and opposing directionality in the non-neural cell-type (K562), highlighting the issue of cell-type context for MPRA. Cellular diversity in the brain is enormous, however, since ES-derived neurons are more fetal-like rather than adult-like, some daSNVs active in mature neurons, such as those mediating synaptic transmission, may have been missed in the current study. Future work may extend efforts to include functional studies in additional brain cell types as well as cells from other tissues that contribute to pathogenesis, notably the immune system.
Accurately assigning target genes to noncoding variants within intact developing human tissue remains challenging. Neuropsychiatric diseases can unfold over decades, with environmental modulation of the activity of regulatory variants, which may account for the lack of a strong correlation between MPRA and eQTL signals. Amalgamating multiple orthogonal approaches—not only tissue-specific eQTL-gene mapping13, but also network-based analyses, literature annotation, cell-type-matched chromatin looping, functional assays in relevant cell types, and new predictive models, may help prioritize targets for further study. We observed that putative daSNV eGenes were enriched in genes mutated in Mendelian CNS diseases and coding variants identified in SCZ exome sequencing, indicating that these genes may be altered in multiple ways to promote the pathogenesis of neuropsychiatric disease. The link from variant, to gene, and gene function in the appropriate tissue to clinical outcomes remains a major goal in polygenic disease.
Cross-disorder analysis of neuropsychiatric genetic risk may help uncover the genetic basis of common psychiatric clinical symptoms and translate variant-gene linkage information into useful personalized therapies. The roughly 22% of eGenes identified here, which are common between multiple disorders, nominate shared biologic processes, primarily those impacting neural development. Gene-disease connections were extended to nominate gene-symptom linkages, where symptoms are clinical features, such as anxiety or psychoses, shared across multiple neuropsychiatric disorders. Such a gene-symptom approach to disease classification highlights well-known difficulties in establishing psychiatric diagnoses for many persons whose combination of clinical features fail to fit into current diagnostic schemas. Extending such gene-symptom linkage may advance efforts towards more precise neuropsychiatric disease subtyping and symptom-targeted therapies. Regarding the latter, identification of pathogenic risk networks shared across multiple neuropsychiatric disorders may help apply pharmacogenomic understanding to commonly impacted biological processes. For example, inherited mutations in TOR1A, an eGene implicated above in multiple neuropsychiatric diseases, cause dystonia57, a known side effect of some antidepressants and antipsychotics. Defining associations between TOR1A daSNVs and dystonia-related medication side effect profiles, may assist personalized approaches to psychiatric drug treatment in multiple diseases. Enhanced understanding of regulatory risk variants may thus have the potential to improve both molecular classification and treatment of human neuropsychiatric disorders.
Methods
Statistics and Reproducibility
Sample sizes for each experiment and statistical power calculations are noted in each of the analyses sections in the Methods. Sample sizes were chosen to provide sufficient confidence to validate methodological conclusions. Specifically for barcode number, power analysis for different levels of barcodes at 4 different log2-fold change thresholds was performed fig S1D. Sample size of 2221 variants was chosen based on technical feasibilities during cloning and library preparation that limited final library size. Replicates are noted with respect to each experiment performed. All experiments were performed with two or four biological replicates and technical duplicates. MPRA data for H9 Day 28, HMC3 microglia and NT2 human embryonal carcinoma cell line were excluded from final analysis due to poor replicability and sequencing quality. The experiments were not randomized. The Investigators were not blinded to allocation during experiments and outcome assessment.
Statistical analyses were performed with R version 3.6.1 and Python 3.7.4 in Jupyter Notebook. Parameters such as number of replicates, the number of independent experiments, measures of center, dispersion, and precision (mean ± SD or SEM), statistical test and significance, are reported in Figures and Figure Legends. Raw sequencing data was processed on Stanford’s Sherlock cluster. All boxplots shown have a maximum whisker length of 1.5*IQR. The center line represents the median; the box edges represent the upper and lower quartiles, and any points visible are outliers. Data distribution was assumed to be normal but this was not formally tested. Wherever possible, nonparametric tests (such as U-tests) were used to avoid assumptions of normality.
Analyses are described in the below Methods subsections are central to generation of the Main Figures. Additional information can be found in Supplementary Methods.
Ethics Statement
This research complies with all relevant ethical regulations. The use of human embryonic stem cells (H9) was carried out in accordance with Stanford University and its Center for Human Embryonic Stem Cell Research and Education. The serum magnesium study in the VA cohort project was approved by the Stanford University Institutional Review Board under the protocol entitled “Public Health Surveillance in the Department of Veterans Affairs”. As the project was considered minimal risk, consent to participate was not required. Bitscopic is operating under a 10-year Research and Development agreement with the VA signed in 2019.
Materials Availability
Two new plasmids are generated and used, pGreenFire_blastocidin (Addgene, #174103) and pD2_miniluc_newP7 (Addgene, #174105). Materials will be available, subject to materials transfer agreements (MTAs). All primer sequences are included in the supplementary table file. Please contact authors for further information.
MPRA library
MPRA library design and variant selection
Variants for the ten neuropsychiatric conditions were selected by collating SNVs listed in GWAS catalog58 (December 2018) and curated psychiatric GWAS papers for a total of 13,956 index SNVs. Additionally, ClinVAR59 SNVs linked to putative psychiatric-linked genes, nominated by PsychENCODE2 (http://resource.psychencode.org/ ) and OMIM60 (https://www.omim.org/), were added (n=1,948 SNVs). Linked SNVs were determined using by using LD information from Haploreg v461, filtering for r2>0.8 for a total of 268,545 SNVs. Additionally, SNVs were filtered through ENCODE DHS62 immune and neuron cell narrow peaks as listed in Data S5 sheet “DHS tissue filter for MPRA”, as well as associated with eQTLs from PsychENCODE2 and GTEx v713 yielding 61,134 SNVs remaining.
Given, constraints of the final MPRA library size, SNVs included in the final MPRA library were prioritized based on annotated information. If a GWAS p-value for the SNV was available, only SNVs with p-values < 1e-6 were kept. For SCZ, BPD, and ADHD, a more stringent p-value threshold of 1e-8 was used. Additionally, SNVs were annotated using CADD v1.463. SNVs with predicted motifs and CADD phred-like c-scores > 20 were included, if possible. Additionally, we note that we selected signal negative controls that are in blacklisted regions by ENCODE hg19 (n=22) to test via MPRA.
We designed a set of DNA fragments by obtaining the genomic sequence corresponding to a 145 bp window centered at each variant of interest (hg37). For each variant, a reference and alternative sequence was designed, corresponding to each allele. In cases where multiple alternate alleles were given for a SNV, all sequence possibilities were included. Sequences were filtered to ensure the restriction sites for EcoRI, BamHI, XhoI, and XbaI were not present. For XbaI, sequences were additionally filtered such that dam methylation recognition sequences would not be present. This process yielded 2,221 SNV locations to be tested.
Each MPRA library oligo included, in order: a MPRA forward primer, the 145 bp genomic instance sequence, a XhoI restriction site, a 10bp randomly generated filler sequence, a XbaI restriction site, a 20bp barcode, and a MPRA reverse primer . The 20bp barcodes are all a minimum Hamming distance of 3 apart. Each unique genomic instance is barcoded 10 times. This yields a 44,400–230bp oligo library that was synthesized by the Agilent HiFi synthesis process. Library cloning is described in Supplementary Methods.
Cell Culture
Infection and culture of Normal Human Astrocytes (Lonza, CC-2565), HEK293T (Takara, cat. no. 632180), SH-SY5Y neuroblastoma cells (ATCC, CRL-2266), IMR-32 neuroblastoma cells (ATCC, CCL-127), D283 medulloblastoma cells (ATCC, HTB-185), and D341 medulloblastoma cells (ATCC, HTB-187) for the MPRA experiments are described in Supplementary Methods.
Differentiation of human embryonic stem cells into human anterior (A-NPC) and posterior neural stem cells (P-NPC)
We followed the protocol previously described64. Human ESC line H9 (WA09 line, NIH registry 0046, University of Wisconsin) were plated in clumps in the presence of Y27632 (10mg/ml, 1000x, Axon MedChem). The hES colonies were allowed to grow in mTESR (Stem Cell Technologies cat #85850) for another day before the media was switch to differentiation media (1X N2, 1X B27, DMEM/F12: Neurobasal=1:1 (Invitrogen), 0.1mM Ascorbic acid (Sigma)) with small molecules [SB431542, LDN193189 and CHIR99021 (Final concentration: 10μM, 100nM and 3μM from Stemgent and Tocris)]. To obtain anterior or posterior neural stem cells, SB431542/LDN194189 and SB431542/LDN193189/CHIR99021 were added respectively. The cells were allowed to differentiate in the media for 6 days before they were dissociated with Accutase and plated at the density of 1 million cells per well of 6 wells for infection. For Ngn2 day 2 post-dox induction cells, TetO-Ngn2-t2a-puro and FUW-rtTA were infected at day 0 in differentiation media followed by adding doxycycline and puromycin the next day. The cells were selected for two days in puromycin before collection for downstream experiments.
Generation of iN cells for Psych MPRA
The inducible Ngn2 human embryonic stem cell line (H9) was created by infecting Human ESC line H9 (WA09 line, NIH registry 0046) with TetO-Ngn2-PGK-puromycinR and FUW-rtTA-IRES-hygromycinR and selecting with puromycin and hygromycin for more than one week. The Ngn2 inducible line was maintained under the feeder-free conditions in mTeSR (Stem Cell Technologies cat. # 85850). For neuron generation, the inducible Ngn2 ES cell line were treated with Accutase and incubate for ~5 to 10 mins at 37C to obtain single cell suspension; resuspended 2 X 10^6 cells in 2ml mTseR + Thiazovivin, and infected with 15ul Psych MPRA lentiviruses and plated on the Matrigel (BD bioscience). After approximately 16–18 hr of infection, the media was changed to N3 medium (DMEM/F12 1:1 cat# 11320–033 (500ml), 5ml N2 (1x) 5ml cat# 17502–048, NEAA (1x), 1.6 ml insulin (stock 6.25mg/ml, Sigma) 2.5ml P/S) with Dox to induce the TetO genes expression. On day 1, a 48h puromycin selection (2 mg/l, Sigma), hygromycin(400ug/ml) and blasticidin (2ug/ml) period was started, and the medium containing antibiotic and Dox was changed every day.
MPRA library sequencing and analysis
Both the plasmid library and cDNA libraries for replicates of each cell condition were sequenced. The plasmid library was sequenced to assess oligo frequencies. Briefly, final libraries concentrations were assessed by Kapa Library Quantification Kit (Roche) and sequenced on an Illumina MiSeq instrument using 30 cycles for read 1 (barcode) and 115 cycles for read 2 (genomic instance). Paired-end sequencing was used to assess template switching. To count number of reads per unique barcode sequence, we took the read 1 sequence, extracted the 20bp region corresponding to the random barcode, and aligned the sequence to the reference MPRA library using bowtie265 . Barcodes were allowed a maximum of one mismatch during alignment. The barcodes were counted to determine barcode-oligo frequencies in the plasmid library. Similar alignment was done with read 2 to align the sequence to the genomic instance of the variant to assess for template switching.
cDNA libraries were synthesized from total RNA, as previously described66. Library concentrations were determined using a Kapa Library Quantification Kit (Roche) and on an Agilent Bioanalyzer. Average molarity was used to equally mix a final cDNA library. Libraries were sequenced on an Illumina MiSeq instrument to ensure each sample had adequate coverage. Deeper sequencing runs were performed on an Illumina Novaseq 6000 SP flow cell (Novogene) with 50 read1 cycles, 8 index1 cycles, and 20 index2 cycles. cDNA library barcode-oligo counts were determined in the same manner as the DNA plasmid library.
ChIP PCR
For episomal ChIPs, ~18 X 106 HEK293T cells were transfected with 15 ug plasmid encoding 461 bp chromosomal fragments with the reference or alternative alleles of rs301806 and rs301807 in central position. Cells were harvested ~20 hrs post transfection and crosslinked with 1% formaldehyde. After nuclei isolation, samples were sonicated for 35 minutes using 30 seconds ON/OFF cycles in Bioruptor (Diagenode) to fragment the plasmids. Samples were then immunoprecipitated with Normal Rabbit IgG (Cell Signaling Technology #2729sor rabbit anti-RUNX1 / AML1 antibody (Abcam, #ab23980). 5ul RUNX1 antibody (1 ug/ul) and 5 ul Normal Rabbit IgG antibody (1 ug/ul) were used for each ChIP reaction. Primer sets used for qPCR are listed in Supplemental Tables S15.
CRISPRi
dCas9-BFP-KRAB from pC13N-dCas9-BFP-KRAB, a gift from Martin Kampmann (Addgene plasmid #127968) was cloned into pLex-CMV. Guides were designed using CRISPick67 and CRISPOR68 to choose 2 guides for each target. Safe targeting guides were chosen from random region targeting sequences from Gasperini, et al69. CRISPRi guides were cloned into the pLentiGuide plasmid (Addgene 117986) using Gibson assembly (NEB). Virus was made for both pLex-dCas9-BFP-KRAB and the guide library by transfecting LentiX 293T (Takara Bio) cells with Lipofectamine 3000 (Invitrogen). Neuroblastoma cell line SH-SY5Y and 293T cells were infected with concentrated pLex-dCas9-BFP-KRAB virus and guide virus. After infection, cells were selected with blasticidin and puromycin for 2–3 days. Cells were then plated into 6 well plates and 6 replicates were harvested for each guide. RNA was extracted using a Qiagen RNeasy kit. cDNA was prepared using iScript cDNA synthesis kit (BioRad) with 500 ng RNA. qPCR was performed for genes nearby or implicated by GTEx, eQTLgen or HiChIP using SYBR green PCR Master Mix (Thermo Fisher).
HDR Vector Construction
The donor ssAAV vector used as a template for homologous directed recombination (HDR), was constructed by cloning of ~1200bp genomic DNA sequence flanking the 5’ and 3’ end of the target SNP rs12264415 into the AAV transfer plasmid between AAV ITR sequences. For each editing experiments two consecutive constructs were generated differed by presence of the reference and alternate allele. During genomic amplification, T/G point mutation was engineered representing substitution of the reference allele T to the alternate allele G. For genomic DNA amplification, CNNM-F/R primers (Table S15) contained homology arms to the AAV transfer vector allowing In-Fusion assembly into NheI/EoRI digested plasmid. After conformation of the insert sequence integrity for both reference and alternate allele containing plasmids, constructs were used for AAV virus production at the Stanford Neuroscience Gene Vector and Virus Core. AAV-DJ serotyped donor ssAAV virus was produced at genomic titer of 2–3×10¹³ TU/mL and used for HDR experiments at MOI 2.5×10⁵.
CRISPR and AAV mediated HDR
The guide sequences targeting reference SNP for CRISPR/Cas9 or CRISPR/Cpf1 genome editing was predicted using CHOPCHOP web tool70 and were ordered from IDT as sgRNA or crRNAs accordingly (Table S15 for gRNAs). For CRISPR/Cas9 genome editing 73 pmol of the sgRNA was complexed with 61 pmol Recombinant Alt-RspCas9 protein (IDT), while for CRISPR/Cpf1 editing 150pmol crRNA was complexed with equimolar amount of Alt-RAsCas12a (IDT) in 10 ul of Amaxa nucleofection buffer from kit V (Lonza) for 10 minutes and immediately used for nucleofection of 8×10⁵ primary SH-SY5Y cells with Amaxa nucleofection apparatus (Lonza) using program G-004. After recovery cells were mixed with AAV virus containing either reference or alternate allele containing donor template at MOI 2.5×10⁵, split into 2 wells of a 6-well plate and propagated for 72hrs. After culture reached 60–80% confluence cells were grown into 10 cm plates during with genomic DNA was isolated and evaluated for the editing efficiency using PCR amplification and sequencing of the bulk cell papulation, as well as by cloning of the amplified fragment into pBluescript vector and evaluating editing efficiency by individual colony sequencing. The population of cells with at least over 70% HDR editing efficiency were used for further experiments.
Epigenomic data generation and processing
Detailed data generation, sequencing reads processing methods, and differential analysis for RNA-seq, ATAC-seq, and HiChIP are listed in Supplementary Methods. Briefly, RNA-seq data was generated using the Illumina protocol (cat# 015.96) for total RNA. RNA-seq reads were aligned to hg19 reference genome using STAR aligner (version 2.5.4b)71 and transcripts per million (TPM) values were calculated using RSEM (version 1.3.0)72. Fast-ATAC sequencing on astrocyte biological replicates was performed as previously described73. ATAC-seq read alignment, quality filtering, duplicate removal, transposase shifting, peak calling, and signal generation were all performed through the ENCODE ATAC-seq pipeline (https://github.com/ENCODE-DCC/atac-seq-pipeline). HiChIP data generation protocol was performed for Astrocytes, ESC cells, N-D2, N-D4, N-D10, and N-D28 as previously described18. HiChIP paired-end reads were aligned to the hg19 genome using the HiC-Pro pipeline74 v2.11.1, with additional filtering steps using hichipper75 v0.7.0 and FitHiChIP76
ATAC-seq footprinting
ATAC-seq peaks were footprinted using the rgt package77 (https://github.com/CostaLab/reg-gen), which uses an HMM-based model to identify active transcription factor binding sites in open chromatin (aka ATAC peaks). HOCOMOCO v11 motifs used in this analysis were pre-processed to increase motif quality. Non-informative bases (information content (IC) < 0.4) were removed from both ends of the motif. To perform the footprinting process, bam files for each cell type were merged and sorted into a single file. Similar merging and sorting process is performed for bed files for each cell type. “rgt-hint footprinting” was called for each cell type. And then “rgt-motif analysis matching” was called to identify HOCOMOCO motif PWMs (https://hocomoco11.autosome.org/) that map to the specified footprinted region.
Target Gene Identification
Target genes of daSNV-associated transcription factors were determined using chromatin interaction (HiChIP) and accessibility (ATAC-seq) data gathered within the H9-derived cell model. First, transcription factors in the HOCOMOCO v11 database (https://hocomoco11.autosome.org/) were identified via DNA footprinting. A target gene of a daSNV TF is defined as having an ATAC footprint of the TF’s corresponding motif within the target gene’s promoter region (defined as 200 bp upstream and 50 bp downstream) of the transcription start site. Distally looped target genes (where the transcription factor footprint was brought into the proximity of the target gene’s TSS), were analyzed but not included in the final analysis. Additionally, both the transcription factor and target gene had to be expression TPM>1 in cell type matching the ATAC profile. GO enrichment analysis was performed using the clusterProfiler78 3.14.0 R package, and visualized using ggplot.
Enrichment calculation
To determine the GO processes enriched in daSNV-associated genes versus genes from our initial GWAS database, geneset enrichments were calculated using a hypergeometric test using the R package ClusterProfileR78 v3.14.0, and significance was reported for FDR-corrected p-value < 0.05. Enrichments were mostly shown as dotplots with geneset (i.e. GO biological process, REACTOME pathway, etc.) on one axis and cell-type on the other axis. The size of the circle represents the number of genes associated with given geneset. The color of the circle represents the multiple-hypothesis corrected p-value for the hypergeometric test.
Cell-specific heritability estimates
Stratified LDSC, as previously described26–28, can be used to obtain cell-specific disease-heritability estimates using GWAS summary statistics. Pre-processed summary statistics from 25 neuropsychiatric GWAS and 19 non-neuropsychiatric GWAS were obtained from Broad webpage (https://alkesgroup.broadinstitute.org/LDSCORE/all_sumstats/). Using the LDSC29,79 software provided on Github (https://github.com/bulik/ldsc) and reference data on the Broad webpage (https://alkesgroup.broadinstitute.org/LDSCORE/), annotation and LD score files were generated for each cell-type from ATAC-seq and RNA-seq from this paper with a control epigenetic set extracted from previously published epithelial data set80. bed files containing cell-specific epigenetic and transcriptomic profiles, separately. Using standard parameters, the “make_annot.py” and “ldsc.py” (with the “--l2” flag) scripts were first used to generate the cell-specific annotation and LD files, then the “ldsc.py” (with the “--h2-cts” flag) script was used to generate cell-type specific portioned heritability scores for each GWAS.
eQTL-based gene networks
Gene networks for each disease were generated by extracting eQTLs listed in GTEx v8 (for neural tissues) and PsychEncode eQTLs for daSNVs of each disease and then plotted in CytoScape v3.7.2. Genes were linked via STRING-db81 and color-coded based on annotated protein function. Function clusters were curated based on frequently appearing key terms. Putative disease-specific and psychiatric genes of interest were annotated based on a PubMed API query for the [psychiatric disease terms] AND [gene of interest].
Brainmap SMART-seq cortical data82 was used to annotate eQTL-based genesets and heatmaps depicting gene expression across the 128 cortical cell-types is generated via R package pheatmap.
Mendelian-polygenic disease association analysis
To generate a database of neurogenic Mendelian diseases, we curated neuro-related conditions from Online Mendelian Inheritance in Man (OMIM) database60, yielding 68 neuro-relevant Mendelian (or rare) diseases and 1132 genes (table S12). Diseases were chosen based on whether a central nervous system-related symptom was central to the disease phenotype as the primary mechanism of disease. A hypergeometric test was used to assess the significance of the genes which overlap between neuro-relevant Mendelian disease genes and daSNV gene MPRA hits. A Venn diagram was plotted using the python venn2 function. Geneset enrichment analysis was performed on the overlapping genes using EnrichR83 (https://maayanlab.cloud/Enrichr/). GWAS Catalog 2019 and Human Gene Atlas geneset enrichment results were plotted as bar plots.
Protein coding mutation analysis
Protein coding variants for schizophrenia were extracted from SCHEMA84 (https://schema.broadinstitute.org/) . Proteins were a SCHEMA meta-analysis p-value < 0.05 were shown. The associated proteins are intersected with the schizophrenia eQTL gene list and SNVs were visualized in the WashU Epigenome Browser to determine whether the daSNVs link to the gene of interest. A list of 7 proteins were curated based on existence of protein-truncating variant present and daSNV-gene linkage present in chromatin looping data.
UK Biobank analysis
From UK Biobank (http://www.nealelab.is/uk-biobank/), we extracted the GWAS results for 806 psych codes (table S14). We used LD-score regression software (https://github.com/bulik/ldsc) to determine phenotype heritability (see “Cell-specific heritability estimates” for implementation details). Additionally, we colocalized the UK Biobank SNVs with the daSNV hits from MPRA and filtered for significant SNVs using an FDR cutoff of 0.10. Subsequently, we generated a heatmap using pheatmap, showing log-normalized beta values for genes associated with the daSNV of interest and a psychiatric clinical phenotype. We collapsed the 806 psych codes by phenotype, based on a similarity of their beta-normalized scored across the daSNVs and manually annotated phenotype clusters (n=64). The resultant heatmap was further collapsed as only one gene/per SNV was used to represent the clinical phenotypic profile shown, based on prioritization schema favoring genes with brain-specific expression modulated by, chromatin linkage to, and prior literature evidence for the given daSNV.
Predicting chromatin effects on non-coding sequence variants
To observe how MPRA-derived allele specific variants compare to existing sequence-based computation algorithms for predicting non-coding variant effects, the 2221 MPRA variants were run against DeepSea16 (on http://deepsea.princeton.edu/job/analysis/create/) and gkmSVM85 v0.82.0 as described in the published R package instructions. The distribution of score differences between the reference and alternate sequences for daSNVs vs nonSNVs were compared used a student T-test for each cell-type.
Data Availability
All raw and processed sequencing data are available in GEO accession #GSE182095. For ease of reference, processed TPM values for RNA seq is provided in the data supplement (table S13). Tracks for ATAC and HiChIP were visualized on WashU Epigenome Browser. Raw and processed RNA, ATAC, and HiChIP D0 and D2 Ngn2-derived H9 samples are referenced86. All MPRA summary statistics and raw counts results are provided (Data S5) and processed data is available at https://arvid-data.shinyapps.io/neuropsychiatry/ or Data S3. Previously published GWAS study data used as a basis for this work is noted in each study published and is annotated in online GWAS data resources, including https://www.ebi.ac.uk/gwas/ and http://www.nealelab.is/uk-biobank/. For LDSC scoring, GWAS data used was available and preprocessed by https://alkesgroup.broadinstitute.org/LDSCORE/all_sumstats/. For colocalization studies, available summary statistics are provided: https://zenodo.org/record/3518299#.XbMgFNF7m90. Additional publicly available data sets used include: GTEx v7, Haploreg v4, ENCODE hg19, StringDB (https://string-db.org/), OMIM (https://www.omim.org/), The Drug Repurposing Hub (http://www.broadinstitute.org/repurposing), PsychENCODE (http://resource.psychencode.org/), HOCOMOCO v11 (https://hocomoco11.autosome.org/), UCSC browser (https://genome.ucsc.edu/), Brainmap SMART-seq cortical data (http://portal.brain-map.org/atlases-and-data/rnaseq/human-multiple-cortical-areas-smart-seq ), SCHEMA (https://schema.broadinstitute.org/), and SNVlocs.Hsapiens.dbSNV142.GRCh37.
VA cohort data has restricted access for privacy concerns.
Code Availability
Analyses were done in custom jupyter notebook or Rmarkdown scripts in Python 3.7.4 and R 3.6.1, locally or on the Stanford Sherlock computing cluster. Code to analyze transcriptomics and epigenomics data is available on GitHub (https://github.com/mguo123/pan_omics_psych.git)87. MPRA-based analysis scripts are available here (https://github.com/mguo123/psych_mpra.git)88. Additionally software used includes: LDSC (LD Score) (v1.0.1), MPRAnalyze (v1.4.0), STAR aligner (v2.5.4b), RSEM (v1.3.0), ENCODE ATAC-seq pipeline (https://github.com/ENCODE-DCC/atac-seq-pipeline), Bowtie2 (2.3.4.1), EnrichR (https://maayanlab.cloud/Enrichr/). ChIPSeeker (v1.22.0), motifBreakR (v2.10.2), rgt (https://github.com/CostaLab/reg-gen), ClusterProfileR (v3.14.0), RColorBrewer (v1.1.0) HiC-Pro (v2.11.1), Hichipper (v 0.7.7), FitHiChIP (v7.0.0), diffloop(v1.10.0), DESeq2 (v1.26.0), CytoScape v3.7.2 , ABC-Enhancer-Gene-Prediction (https://github.com/broadinstitute/ABC-Enhancer-Gene-Prediction), gatk (v4.1.9.0), picard (v2.24.0), MACS2 (v2.1.1), enloc (https://github.com/xqwen/integrative), PhenomeXcan (https://github.com/hakyimlab/phenomexcan), gkmSVM (v0.82.0), DeepSea (http://deepsea.princeton.edu/job/analysis/create/), pheatmap (v1.0.12), biothings (v0.2.6), GenomicRanges (v.1.48.0), Rsubread (v2.0.0).
Extended Data
Extended Data Fig 1.
MPRA QC Statistics
Extended Data Fig 2.
Epigenetics study of the role of transcription regulation in neuropsychiatric diseases
Extended Data Fig 3.
eGene Network Analysis of other diseases
Extended Data Fig 4.
POU5F1/OCT4 Vignette
Extended Data Fig 5.
Association between serum magnesium levels and relative psychiatric disease incidence in a VA cohort
Extended Data Fig 6.
RERE Vignette
Extended Data Fig 7.
CMAP drug perturbation analysis
Extended Data Fig 8.
Gene concordance for variant annotation approaches
Supplementary Material
Acknowledgments:
We thank Suhas Srinivasan for the creation of web resource. We thank G. Rayant and K. Fields for their generous support and helpful discussions. We also thank M.P. Snyder, W.J. Greenleaf, D.F. Levinson, and H.Y. Chang for pre-submission review and J. Engreitz and members of the Khavari and Altman laboratories for helpful discussions. This work was supported by USVA Office of Research and Development and by the Atlas of Regulatory Variants in Disease (ARVID) project from NHGRI/NIH U24HG010856 to PAK and by NIAMS/NIH AR076965 to PAK. SBM was supported by R01AG066490 and R01MH125244. AEU was supported by P50HG00773506. This work was supported by Bitscopic’s R&D budget and intramural funding from the Department of Veterans Affairs. The funders had no role in study design, data collection and analysis, decision to publish or preparation of the manuscript. We thank Chong (Chris) Lee, Hemal Parekh, and Joel Mewton for Praedico maintenance, assistance with data extraction and professional support.
Footnotes
Competing interests:
Vafa Bayat and Payam Etminani are employees of Bitscopic, Inc. The remaining authors declare no competing interests.
References
- 1.Schizophrenia Working Group of the Psychiatric Genomics Consortium. Biological insights from 108 schizophrenia-associated genetic loci. Nature 511, 421–427 (2014). [DOI] [PMC free article] [PubMed] [Google Scholar]
- 2.PsychENCODE Consortium TP et al. The PsychENCODE project. Nat. Neurosci 18, 1707–12 (2015). [DOI] [PMC free article] [PubMed] [Google Scholar]
- 3.Ombrato L. et al. Metastatic-niche labelling reveals parenchymal cells with stem features. Nature 572, 603–608 (2019). [DOI] [PMC free article] [PubMed] [Google Scholar]
- 4.Witt SH et al. Genome-wide association study of borderline personality disorder reveals genetic overlap with bipolar disorder, major depression and schizophrenia. Transl. Psychiatry 7, e1155 (2017). [DOI] [PMC free article] [PubMed] [Google Scholar]
- 5.Meier SM et al. Genetic Variants Associated with Anxiety and Stress-Related Disorders: A Genome-Wide Association Study and Mouse-Model Study. JAMA Psychiatry 76, 924–932 (2019). [DOI] [PMC free article] [PubMed] [Google Scholar]
- 6.Tam V. et al. Benefits and limitations of genome-wide association studies. Nature Reviews Genetics vol. 20 467–484 (2019). [DOI] [PubMed] [Google Scholar]
- 7.Zhang F. & Lupski JR Non-coding genetic variants in human disease. Human Molecular Genetics vol. 24 R102–R110 (2015). [DOI] [PMC free article] [PubMed] [Google Scholar]
- 8.Won H. et al. Chromosome conformation elucidates regulatory relationships in developing human brain. Nature 538, 523–527 (2016). [DOI] [PMC free article] [PubMed] [Google Scholar]
- 9.Gandal MJ et al. Shared molecular neuropathology across major psychiatric disorders parallels polygenic overlap. Science vol. 359 http://science.sciencemag.org/ (2018). [DOI] [PMC free article] [PubMed] [Google Scholar]
- 10.Mulvey B, Lagunas T. & Dougherty JD Massively Parallel Reporter Assays: Defining Functional Psychiatric Genetic Variants Across Biological Contexts. Biological Psychiatry vol. 89 76–89 (2021). [DOI] [PMC free article] [PubMed] [Google Scholar]
- 11.Tewhey R. et al. Direct identification of hundreds of expression-modulating variants using a multiplexed reporter assay. Cell 165, 1519–1529 (2016). [DOI] [PMC free article] [PubMed] [Google Scholar]
- 12.Ulirsch JC et al. Systematic functional dissection of common genetic variation affecting red blood cell traits. Cell 165, 1530–1545 (2016). [DOI] [PMC free article] [PubMed] [Google Scholar]
- 13.Lonsdale J. et al. The Genotype-Tissue Expression (GTEx) project. Nature Genetics vol. 45 580–585 (2013). [DOI] [PMC free article] [PubMed] [Google Scholar]
- 14.Zhang Y. et al. Rapid single-step induction of functional neurons from human pluripotent stem cells. Neuron 78, 785–798 (2013). [DOI] [PMC free article] [PubMed] [Google Scholar]
- 15.Ashuach T. et al. MPRAnalyze: statistical framework for massively parallel reporter assays. Genome Biol. 20, 183 (2019). [DOI] [PMC free article] [PubMed] [Google Scholar]
- 16.Zhou J. et al. Deep learning sequence-based ab initio prediction of variant effects on expression and disease risk. Nat. Genet 50, 1171–1179 (2018). [DOI] [PMC free article] [PubMed] [Google Scholar]
- 17.Buenrostro JD, Wu B, Chang HY & Greenleaf WJ ATAC-seq: A Method for Assaying Chromatin Accessibility Genome-Wide. Curr. Protoc. Mol. Biol 109, 21.29.1–9 (2015). [DOI] [PMC free article] [PubMed] [Google Scholar]
- 18.Mumbach MR et al. HiChIP: efficient and sensitive analysis of protein-directed genome architecture. Nat. Methods 13, 919–922 (2016). [DOI] [PMC free article] [PubMed] [Google Scholar]
- 19.Song M. et al. Mapping cis-regulatory chromatin contacts in neural cells links neuropsychiatric disorder risk variants to target genes. Nat. Genet 51, 1252–1262 (2019). [DOI] [PMC free article] [PubMed] [Google Scholar]
- 20.Zhang S. et al. Allele-specific open chromatin in human iPSC neurons elucidates functional disease variants Downloaded from. http://science.sciencemag.org/ (2020). [DOI] [PMC free article] [PubMed] [Google Scholar]
- 21.Inoue F. et al. A systematic comparison reveals substantial differences in chromosomal versus episomal encoding of enhancer activity. (2017) doi: 10.1101/gr.212092.116. [DOI] [PMC free article] [PubMed] [Google Scholar]
- 22.Song M. et al. Mapping cis-regulatory chromatin contacts in neural cells links neuropsychiatric disorder risk variants to target genes. Nat. Genet 51, 1252–1262 (2019). [DOI] [PMC free article] [PubMed] [Google Scholar]
- 23.Herdegen T. & Waetzig V. AP-1 proteins in the adult brain: Facts and fiction about effectors of neuroprotection and neurodegeneration. Oncogene vol. 20 2424–2437 (2001). [DOI] [PubMed] [Google Scholar]
- 24.Chew LJ et al. Sox17 Regulates a Program of Oligodendrocyte Progenitor Cell Expansion and Differentiation during Development and Repair. Cell Rep. 29, 3173–3186.e7 (2019). [DOI] [PMC free article] [PubMed] [Google Scholar]
- 25.Ruiz i Altaba A, Palma V. & Dahmane N. Hedgehog–GLI signaling and the growth of the brain. Nat. Rev. Neurosci 3, 24–33 (2002). [DOI] [PubMed] [Google Scholar]
- 26.Finucane HK et al. Heritability enrichment of specifically expressed genes identifies disease-relevant tissues and cell types. Nat. Genet 2018 504 50, 621–629 (2018). [DOI] [PMC free article] [PubMed] [Google Scholar]
- 27.Skene NG et al. Genetic identification of brain cell types underlying schizophrenia. Nat. Genet. 2018 506 50, 825–833 (2018). [DOI] [PMC free article] [PubMed] [Google Scholar]
- 28.Hook PW & McCallion AS Leveraging mouse chromatin data for heritability enrichment informs common disease architecture and reveals cortical layer contributions to schizophrenia. Genome Res. 30, 528–539 (2020). [DOI] [PMC free article] [PubMed] [Google Scholar]
- 29.Bulik-Sullivan B. et al. LD Score regression distinguishes confounding from polygenicity in genome-wide association studies. Nat. Genet 2015 473 47, 291–295 (2015). [DOI] [PMC free article] [PubMed] [Google Scholar]
- 30.Wang D. et al. Comprehensive functional genomic resource and integrative model for the human brain. doi: 10.1126/science.aat8464. [DOI] [PMC free article] [PubMed] [Google Scholar]
- 31.Kinney DK et al. A unifying hypothesis of schizophrenia: Abnormal immune system development may help explain roles of prenatal hazards, post-pubertal onset, stress, genes, climate, infections, and brain dysfunction. Med. Hypotheses 74, 555–563 (2010). [DOI] [PubMed] [Google Scholar]
- 32.Shao Z. et al. Dysregulated protocadherin-pathway activity as an intrinsic defect in induced pluripotent stem cell–derived cortical interneurons from subjects with schizophrenia. Nat. Neurosci 22, 229–242 (2019). [DOI] [PMC free article] [PubMed] [Google Scholar]
- 33.Hoseth EZ et al. Attenuated Notch signaling in schizophrenia and bipolar disorder. Sci. Rep 8, 1–8 (2018). [DOI] [PMC free article] [PubMed] [Google Scholar]
- 34.Onwordi EC et al. Synaptic density marker SV2A is reduced in schizophrenia patients and unaffected by antipsychotics in rats. Nat. Commun 11, 1–11 (2020). [DOI] [PMC free article] [PubMed] [Google Scholar]
- 35.Yabut OR, Fernandez G, Huynh T, Yoon K. & Pleasure SJ Suppressor of Fused Is Critical for Maintenance of Neuronal Progenitor Identity during Corticogenesis. Cell Rep. 12, 2021–2034 (2015). [DOI] [PMC free article] [PubMed] [Google Scholar]
- 36.Nord AS, Pattabiraman K, Visel A. & Rubenstein JLR Genomic Perspectives of Transcriptional Regulation in Forebrain Development. Neuron vol. 85 27–47 (2015). [DOI] [PMC free article] [PubMed] [Google Scholar]
- 37.Zhang S. et al. OCT4 and PAX6 determine the dual function of SOX2 in human ESCs as a key pluripotent or neural factor. Stem Cell Res. Ther 10, 1–14 (2019). [DOI] [PMC free article] [PubMed] [Google Scholar]
- 38.Hodge RD et al. Conserved cell types with divergent features in human versus mouse cortex. Nature 573, 61–68 (2019). [DOI] [PMC free article] [PubMed] [Google Scholar]
- 39.Nichol H, Amilhon B, Manseau F, Badrinarayanan S. & Williams S. Electrophysiological and morphological characterization of Chrna2 cells in the subiculum and Ca1 of the hippocampus: An optogenetic investigation. Front. Cell. Neurosci 12, 32 (2018). [DOI] [PMC free article] [PubMed] [Google Scholar]
- 40.Giralt A. et al. Pyk2 modulates hippocampal excitatory synapses and contributes to cognitive deficits in a Huntington’s disease model. Nat. Commun 8, 1–16 (2017). [DOI] [PMC free article] [PubMed] [Google Scholar]
- 41.Arjona FJ et al. CNNM2 Mutations Cause Impaired Brain Development and Seizures in Patients with Hypomagnesemia. PLoS Genet. 10, 1004267 (2014). [DOI] [PMC free article] [PubMed] [Google Scholar]
- 42.Li M. et al. A human-specific AS3MT isoform and BORCS7 are molecular risk factors in the 10q24.32 schizophrenia-associated locus. Nat. Med 22, 649–656 (2016). [DOI] [PubMed] [Google Scholar]
- 43.Franken GAC et al. Cyclin M2 (CNNM2) knockout mice show mild hypomagnesaemia and developmental defects. Sci. Reports 2021 111 11, 1–12 (2021). [DOI] [PMC free article] [PubMed] [Google Scholar]
- 44.Scott DA & Sherr EH RERE-Related Disorders. GeneReviews® (University of Washington, Seattle, 1993). [PubMed] [Google Scholar]
- 45.Katsuki A. et al. A single-nucleotide polymorphism influences brain morphology in drug-näve patients with major depressive disorder. Neuropsychiatr. Dis. Treat 15, 2425–2432 (2019). [DOI] [PMC free article] [PubMed] [Google Scholar]
- 46.Logan TT, Rusnak M. & Symes AJ Runx1 promotes proliferation and neuronal differentiation in adult mouse neurosphere cultures. Stem Cell Res. 15, 554–564 (2015). [DOI] [PubMed] [Google Scholar]
- 47.Singh T, Neale BM & Daly MJ Exome sequencing identifies rare coding variants in 10 genes which confer substantial risk for schizophrenia on behalf of the Schizophrenia Exome Meta-Analysis (SCHEMA) Consortium* doi: 10.1101/2020.09.18.20192815. [DOI] [Google Scholar]
- 48.Andrade A. et al. Genetic Associations between Voltage-Gated Calcium Channels and Psychiatric Disorders. International Journal of Molecular Sciences vol. 20 (2019). [DOI] [PMC free article] [PubMed] [Google Scholar]
- 49.Davis KAS et al. Mental health in UK Biobank: development, implementation and results from an online questionnaire completed by 157 366 participants*. (2018) doi: 10.1192/bjo.2018.12. [DOI] [PMC free article] [PubMed] [Google Scholar] [Retracted]
- 50.Subramanian A. et al. A Next Generation Connectivity Map: L1000 Platform and the First 1,000,000 Profiles. Cell 171, 1437–1452.e17 (2017). [DOI] [PMC free article] [PubMed] [Google Scholar]
- 51.Yaghoobi MM, Mowla SJ & Tiraihi T. Nucleostemin, a coordinator of self-renewal, is expressed in rat marrow stromal cells and turns off after induction of neural differentiation. Neurosci. Lett 390, 81–86 (2005). [DOI] [PubMed] [Google Scholar]
- 52.Teng X. et al. KCTD: A new gene family involved in neurodevelopmental and neuropsychiatric disorders. CNS Neuroscience and Therapeutics vol. 25 887–902 (2019). [DOI] [PMC free article] [PubMed] [Google Scholar]
- 53.Imbrici P, Camerino DC & Tricarico D. Major channels involved in neuropsychiatric disorders and therapeutic perspectives. Front. Genet 4, 76 (2013). [DOI] [PMC free article] [PubMed] [Google Scholar]
- 54.Meng Q. et al. Integrative analyses prioritize GNL3 as a risk gene for bipolar disorder. Mol. Psychiatry 25, 2672–2684 (2020). [DOI] [PubMed] [Google Scholar]
- 55.Eby GA & Eby KL Rapid recovery from major depression using magnesium treatment. Med. Hypotheses 67, 362–370 (2006). [DOI] [PubMed] [Google Scholar]
- 56.Myint L. et al. Testing the Regulatory Consequences of 1,049 Schizophrenia Associated Variants With a Massively Parallel Reporter Assay. doi: 10.1101/447557. [DOI] [Google Scholar]
- 57.Calakos N. et al. Functional evidence implicating a novel TOR1A mutation in idiopathic, late-onset focal dystonia. J. Med. Genet 47, 646–650 (2010). [DOI] [PMC free article] [PubMed] [Google Scholar]
- 58.Buniello A. et al. The NHGRI-EBI GWAS Catalog of published genome-wide association studies, targeted arrays and summary statistics 2019. Nucleic Acids Res. 47, D1005–D1012 (2019). [DOI] [PMC free article] [PubMed] [Google Scholar]
- 59.Landrum MJ et al. ClinVar: Improving access to variant interpretations and supporting evidence. Nucleic Acids Res. 46, D1062–D1067 (2018). [DOI] [PMC free article] [PubMed] [Google Scholar]
- 60.Amberger JS, Bocchini CA, Schiettecatte F, Scott AF & Hamosh A. OMIM.org: Online Mendelian Inheritance in Man (OMIM®), an Online catalog of human genes and genetic disorders. Nucleic Acids Res. 43, D789–D798 (2015). [DOI] [PMC free article] [PubMed] [Google Scholar]
- 61.Ward LD & Kellis M. HaploReg v4: Systematic mining of putative causal variants, cell types, regulators and target genes for human complex traits and disease. Nucleic Acids Res. 44, D877–D881 (2016). [DOI] [PMC free article] [PubMed] [Google Scholar]
- 62.de Souza N. The ENCODE project. Nat. Methods 9, 1046 (2012). [DOI] [PubMed] [Google Scholar]
- 63.Rentzsch P, Witten D, Cooper GM, Shendure J. & Kircher M. CADD: Predicting the deleteriousness of variants throughout the human genome. Nucleic Acids Res. 47, D886–D894 (2019). [DOI] [PMC free article] [PubMed] [Google Scholar]
- 64.Du ZW et al. Generation and expansion of highly pure motor neuron progenitors from human pluripotent stem cells. Nat. Commun 6, 1–9 (2015). [DOI] [PMC free article] [PubMed] [Google Scholar]
- 65.Langmead B. & Salzberg SL Fast gapped-read alignment with Bowtie 2. Nat. Methods 9, 357–359 (2012). [DOI] [PMC free article] [PubMed] [Google Scholar]
- 66.Kim D. et al. The dynamic, combinatorial cis-regulatory lexicon of epidermal differentiation. doi: 10.1101/2020.10.16.342857. [DOI] [PMC free article] [PubMed] [Google Scholar]
- 67.Kim HK et al. Deep learning improves prediction of CRISPR-Cpf1 guide RNA activity. Nat. Biotechnol 36, 239–241 (2018). [DOI] [PubMed] [Google Scholar]
- 68.Concordet J. & Haeussler M. CRISPOR : intuitive guide selection for CRISPR / Cas9 genome editing experiments and screens. 46, 242–245 (2018). [DOI] [PMC free article] [PubMed] [Google Scholar]
- 69.Gasperini M. et al. Resource A Genome-wide Framework for Mapping Gene Regulation via Cellular Genetic Screens Resource A Genome-wide Framework for Mapping Gene Regulation via Cellular Genetic Screens. 377–390 (2019) doi: 10.1016/j.cell.2018.11.029. [DOI] [Google Scholar]
- 70.Labun K, Montague TG, Krause M, Cleuren YNT & Valen E. CHOPCHOP v3 : expanding the CRISPR web toolbox beyond genome editing H akon. 47, 171–174 (2019). [DOI] [PMC free article] [PubMed] [Google Scholar]
- 71.Dobin A. et al. STAR: Ultrafast universal RNA-seq aligner. Bioinformatics 29, 15–21 (2013). [DOI] [PMC free article] [PubMed] [Google Scholar]
- 72.Li B. & Dewey CN RSEM: Accurate transcript quantification from RNA-Seq data with or without a reference genome. BMC Bioinformatics 12, 1–16 (2011). [DOI] [PMC free article] [PubMed] [Google Scholar]
- 73.Corces MR et al. Lineage-specific and single-cell chromatin accessibility charts human hematopoiesis and leukemia evolution. Nat. Genet 48, 1193–1203 (2016). [DOI] [PMC free article] [PubMed] [Google Scholar]
- 74.Servant N. et al. HiC-Pro: an optimized and flexible pipeline for Hi-C data processing. Genome Biol. 16, (2015). [DOI] [PMC free article] [PubMed] [Google Scholar]
- 75.Lareau CA & Aryee MJ Hichipper: A preprocessing pipeline for calling DNA loops from HiChIP data. Nature Methods vol. 15 155–156 (2018). [DOI] [PMC free article] [PubMed] [Google Scholar]
- 76.Bhattacharyya S, Chandra V, Vijayanand P. & Ay F. FitHiChIP: Identification of significant chromatin contacts from HiChIP data. (2018) doi: 10.1101/412833. [DOI] [PMC free article] [PubMed] [Google Scholar]
- 77.Li Z. et al. Identification of transcription factor binding sites using ATAC-seq. Genome Biol. 20, 45 (2019). [DOI] [PMC free article] [PubMed] [Google Scholar]
- 78.Yu G, Wang LG, Han Y. & He QY ClusterProfiler: An R package for comparing biological themes among gene clusters. Omi. A J. Integr. Biol 16, 284–287 (2012). [DOI] [PMC free article] [PubMed] [Google Scholar]
- 79.Bulik-Sullivan B. et al. An atlas of genetic correlations across human diseases and traits. Nat. Genet 47, 1236–41 (2015). [DOI] [PMC free article] [PubMed] [Google Scholar]
- 80.Donohue LKH et al. A cis-regulatory lexicon of DNA motif combinations mediating cell-type-specific gene regulation. Cell Genomics 2, 100191 (2022). [DOI] [PMC free article] [PubMed] [Google Scholar]
- 81.Szklarczyk D. et al. STRING v11: Protein-protein association networks with increased coverage, supporting functional discovery in genome-wide experimental datasets. Nucleic Acids Res. 47, (2019). [DOI] [PMC free article] [PubMed] [Google Scholar]
- 82.Welch JD et al. Single-Cell Multi-omic Integration Compares and Contrasts Features of Brain Cell Identity. Cell 177, 1873–1887.e17 (2019). [DOI] [PMC free article] [PubMed] [Google Scholar]
- 83.Chen EY et al. Enrichr: Interactive and collaborative HTML5 gene list enrichment analysis tool. BMC Bioinformatics 14, (2013). [DOI] [PMC free article] [PubMed] [Google Scholar]
- 84.Singh T. et al. Rare coding variants in ten genes confer substantial risk for schizophrenia. Nature 604, 509–516 (2022). [DOI] [PMC free article] [PubMed] [Google Scholar]
- 85.Ghandi M, Lee D. ¤, Mohammad-Noori, M. & Beer, M. A. Enhanced Regulatory Sequence Prediction Using Gapped k-mer Features. PLoS Comput Biol 10, 1003711 (2014). [DOI] [PMC free article] [PubMed] [Google Scholar]
- 86.Ang CE et al. The Dynamic Interplay Between Homeodomain Transcription Factors and Chromatin Environment Regulates Proneural Factor Outcomes. bioRxiv 2020.12.02.398677 (2020). [Google Scholar]
- 87.mguo123/pan_omics_psych: Publication release. https://zenodo.org/record/8098407 doi: 10.5281/zenodo.8098407. [DOI] [Google Scholar]
- 88.mguo123/psych_mpra: Publication release. https://zenodo.org/record/8098409 doi: 10.5281/zenodo.8098409. [DOI] [Google Scholar]
Associated Data
This section collects any data citations, data availability statements, or supplementary materials included in this article.
Supplementary Materials
Data Availability Statement
All raw and processed sequencing data are available in GEO accession #GSE182095. For ease of reference, processed TPM values for RNA seq is provided in the data supplement (table S13). Tracks for ATAC and HiChIP were visualized on WashU Epigenome Browser. Raw and processed RNA, ATAC, and HiChIP D0 and D2 Ngn2-derived H9 samples are referenced86. All MPRA summary statistics and raw counts results are provided (Data S5) and processed data is available at https://arvid-data.shinyapps.io/neuropsychiatry/ or Data S3. Previously published GWAS study data used as a basis for this work is noted in each study published and is annotated in online GWAS data resources, including https://www.ebi.ac.uk/gwas/ and http://www.nealelab.is/uk-biobank/. For LDSC scoring, GWAS data used was available and preprocessed by https://alkesgroup.broadinstitute.org/LDSCORE/all_sumstats/. For colocalization studies, available summary statistics are provided: https://zenodo.org/record/3518299#.XbMgFNF7m90. Additional publicly available data sets used include: GTEx v7, Haploreg v4, ENCODE hg19, StringDB (https://string-db.org/), OMIM (https://www.omim.org/), The Drug Repurposing Hub (http://www.broadinstitute.org/repurposing), PsychENCODE (http://resource.psychencode.org/), HOCOMOCO v11 (https://hocomoco11.autosome.org/), UCSC browser (https://genome.ucsc.edu/), Brainmap SMART-seq cortical data (http://portal.brain-map.org/atlases-and-data/rnaseq/human-multiple-cortical-areas-smart-seq ), SCHEMA (https://schema.broadinstitute.org/), and SNVlocs.Hsapiens.dbSNV142.GRCh37.
VA cohort data has restricted access for privacy concerns.


