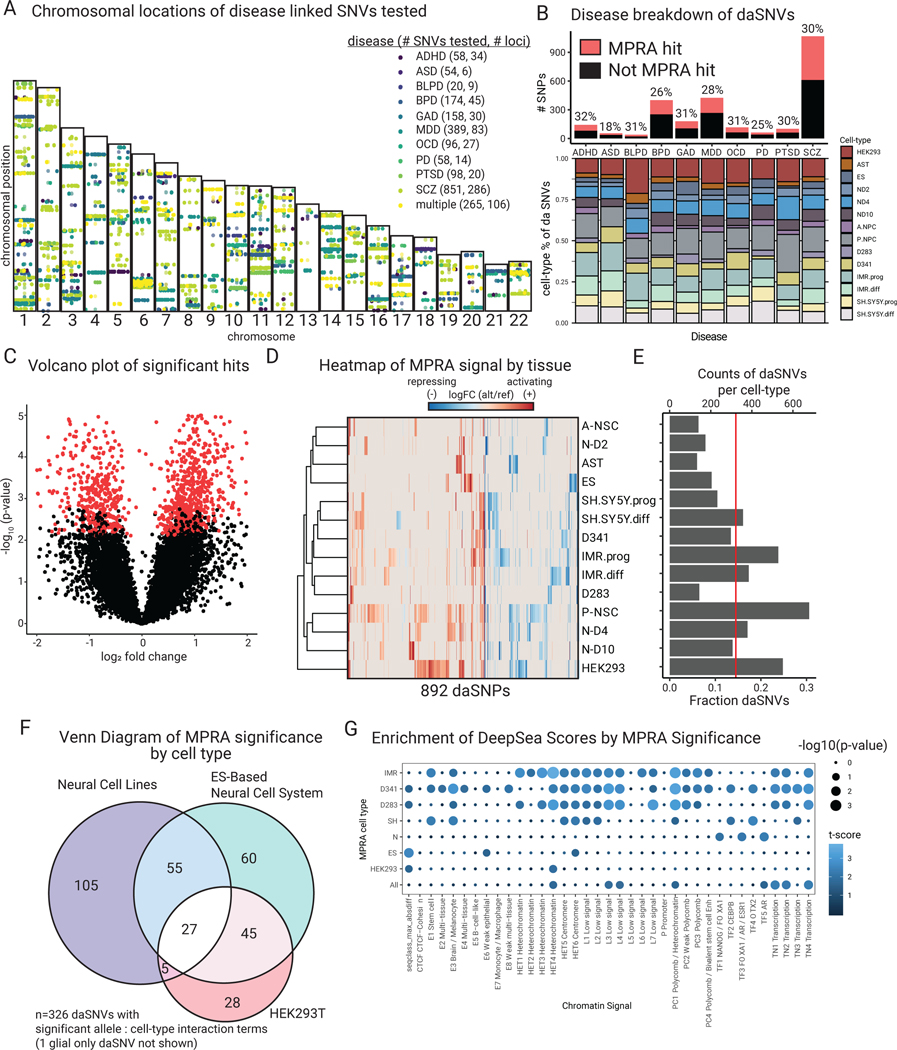
Fig. 2. MPRA identifies 892 functional daSNVs across 10 different neuropsychiatric diseases.
(A) Chromosomal map of locations of 2221 SNPs tested and their disease annotations (abbreviations: ADHD=attention-deficit hyperactivity disorder, ASD=autism spectrum disorder, BLPD=borderline personality disorder, BPD=bipolar disorder, GAD=generalized anxiety disorder, MDD=major depressive disorder, OCD=obsessive-compulsive disorder, PD=panic disorder; PTSD=post- traumatic stress disorder, SCZ=schizophrenia). (B) Barplot (above) indicating the fraction of assayed SNPs that were significant, separated by disease; ~30% of SNVs tested were deemed significant, with the exception of ASD, barplot (below) shows further distribution of daSNVs across cell types and conditions tested. (C) Volcano plot of -log10(p-value) vs log2 fold change indicating significant hits (red dots). (D) Heatmap of log2 fold change of alternative over reference allele activity captured by MPRA for the 892 significant hits. To the left, a row-based dendrogram of the heatmap shows relatedness of cell types and conditions by daSNV profile. To the right, (E) Barplot showing counts and fractions of daSNVs by cell-type, the red line shows the average fractions of daSNVs significant by cell-type = 0.145. (F) Venn diagram of the daSNVs showing significant cell-type dependent allelic activity (FDR<0.05) within neural cell lines, the ES-based neural cell system, and HEK293T (325 of the 326 significant variants are shown, as glial cells are not shown). (G) Dotplot showing enrichment of DeepSea Scores based on MPRA significance, where color is the -log10(p-value) and the size is the t-statistic for a two-sided Student T-test between the distribution of the allelic differential for the sequences scores classes for daSNVs vs non-daSNVs.

