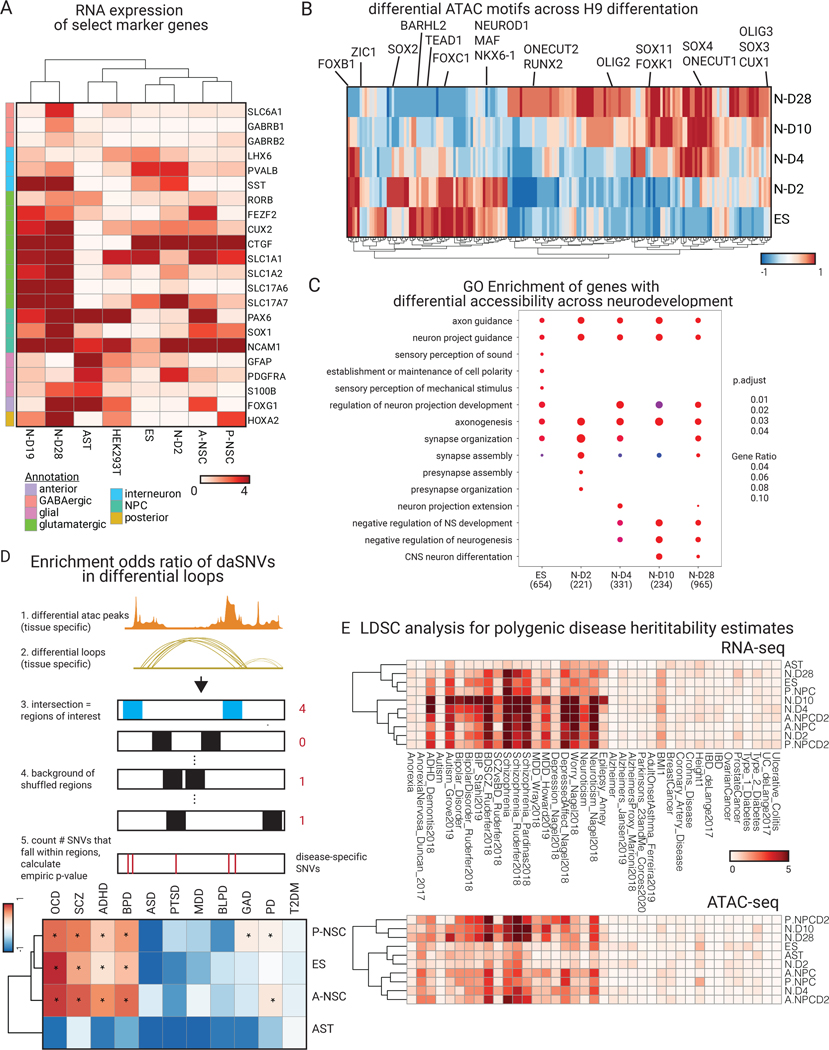
Fig. 3. Epigenetic profiling of neural cell system shows neuropsychiatric disease relevance.
(A) RNA-seq expression heatmap of key marker genes for each cell type. FOXG1 and HOXA2 are expressed in our anterior and posterior neural stem cells, respectively. PDGFRA and GFAP are expressed in astrocytes. SLC glutamatergic gene markers are expressed at later stages of neuronal differentiation. (B) Heatmap of normalized motif occurrences in differential ATAC peaks over the time course of H9-derived neuronal differentiation. Motifs known to be more prominent in early neuronal differentiation (NEUROD1, ZIC1) are highlighted vs later neuronal differentiation (SOX11, CUX1). (C) GO biological process enrichment dot plot showing Benjamin-Hochberg-corrected p-values from two-sided hypergeometric tests for enrichment of genes found nearest to ATAC peaks within H9-derived cells across the temporal neuronal differentiation axis. (D) (above) a schematic of the GWAS tissue and disease-specific enrichment approach used (see Methods for more details) to derive a heatmap (below) of enrichment odds ratio of the daSNVs by disease over differential loop regions that were filtered by ATAC peaks. Type 2 diabetes mellitus (T2DM) was used as a control and indicated no enrichment. Enrichment was concentrated to the neuronal stem cells and the embryonic stem cell neuronal lineages (Data S1). (E) cell-type specific LDSC hereditability estimate negative log10(p-values) heatmaps for RNA-seq (above) and ATAC-seq (below) in the ES-derived neural cell system and relevant neural cell types.

