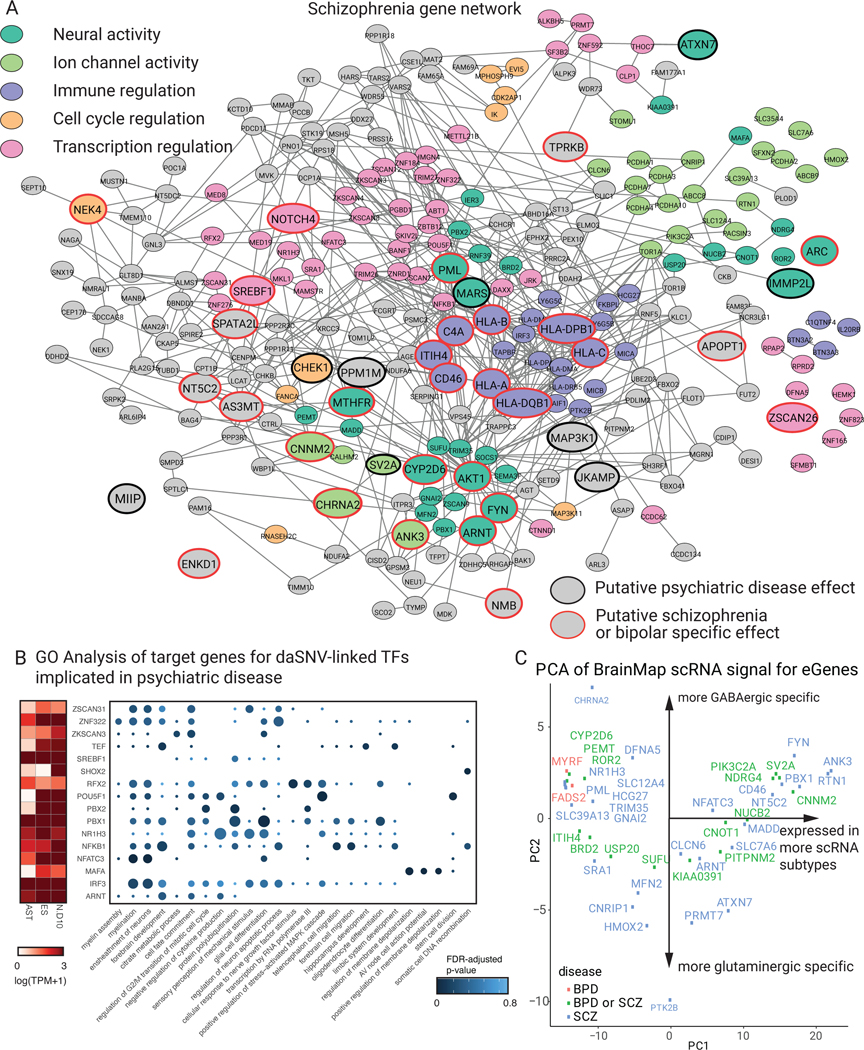
Fig. 4. daSNV eGene networks and their transcription regulatory effects.
Protein-protein interaction network of eGenes assigned to (A) SCZ-associated daSNVs by GTEx and PsychEncode. Black outlined nodes were genes implicated in neuropsychiatric disorder disease risk based on an automated PubMed annotation pipeline; red outlined nodes were genes implicated specifically in SCZ. Nodes are color coded by neuropsychiatric-relevant functional process. (B) A dotplot depicting GO biological processes for target genes of TF daSNVs associated with neuropsychiatric diseases, where the color indicates FDR-adjusted two-sided p-value from hypergeometric test for enrichment, the size of the dot indicated geneset size, and is accompanied by an expression heatmap (left) showing log10(TPM+1) expression values for the TFs in neural relevant tissues assayed. (C) Scatter plot of principal component (PC) loadings for PC2 vs PC1, where loadings represent expression profiles from 127 cortical subtypes derived from Allen Brain Atlas scRNA-seq data, each point is an eGene. PC1 loadings correlate to expression of the gene in an increasing number of scRNA cortical subtypes. PC2 denotes the GABAergic vs glutaminergic cell type axis with CHRNA2 having a mostly GABAergic signature, while PTK2B has a mostly glutaminergic signature.

