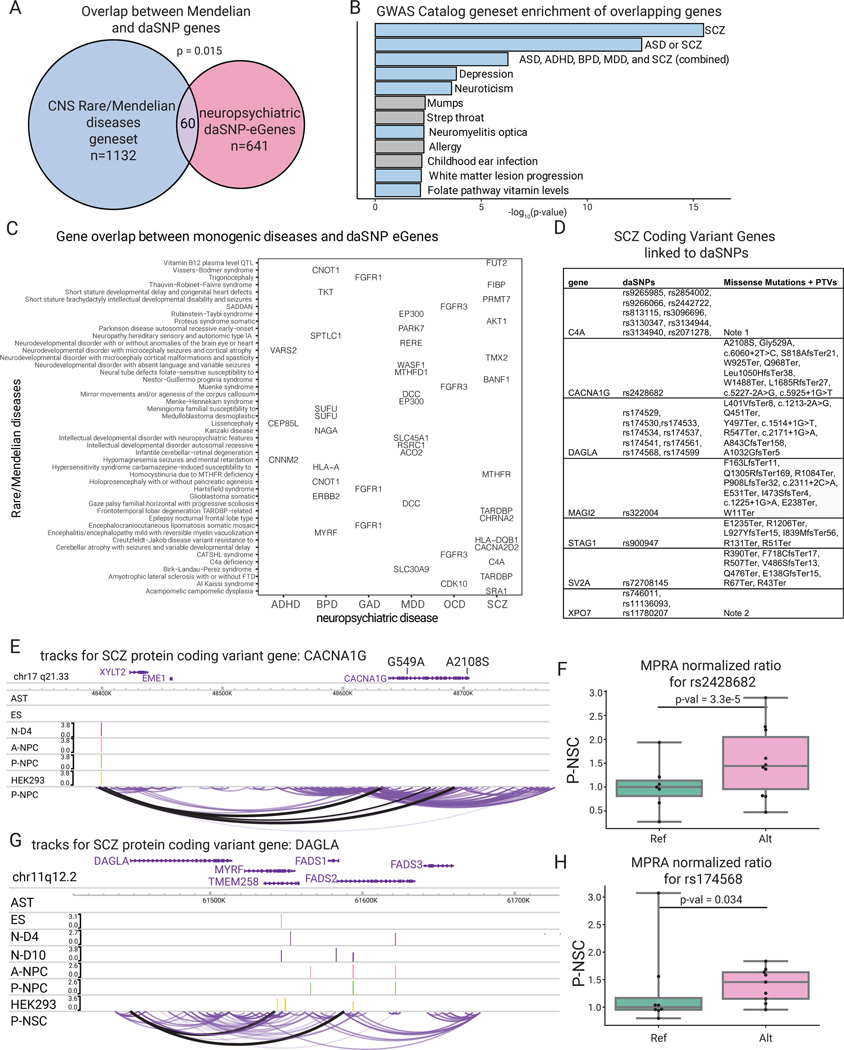
Fig. 6. Altered coding genes in CNS diseases inform risk in psychiatric disorders.
(A) Venn diagram depicting overlap between Mendelian CNS disease genes and the neuropsychiatric eGenes linked to daSNVs; p-value=hypergeometric test between the two gene sets over a background of all potential disease-associated genes (n=15999 possible Mendelian genes). (B) Gene set enrichment analysis calculated by EnrichR with Benjamin-Hochberg corrected p-value from a two-sided hypergeometric test for the 2019 GWAS Catalog of the 60 overlapping genes, where the blue bars indicate diseases of neuropsychiatric etiology or linkage. (C) Grid chart of genes in the intersection between rare/Mendelian diseases and the neuropsychiatric diseases. (D) Abbreviated table of SCZ Coding Variant Genes linked to chromatin data (see also table S1). (E) Tracks for CACNA1G, where the peak tracks show the logFC change from cell-type specific MPRA for the daSNVs, and the bottom loop track shows the looping data for P-NPC cell type, indicating the daSNV rs2428682 loops to the promoter of CACNA1G. Scales are only included if there was a peak within the given region shown. (F) Box-and-whisker plot showing normalized MPRA counts ratios for reference (green) to alternate (pink) allele for rs2428682 in P-NPC, where the center line is the median of each MPRA normalized ratio (each point is a genomic barcode instance with at least one count, n=7 for Ref, n=10 Alt), box limits are the upper and lower quartiles, whiskers are the 1.5x interquartile range, and points shown are outliers. Ratios are normalized to the median reference allele values. FDR-corrected p-values were calculated using MPRAnalyze’s likelihood ratio test indicate significant allele specific activity (p=3.3e-5). (G) Similar track for coding variant gene DAGLA. (H) Box-and-whisker plot showing normalized MPRA ratios for one of the daSNVs linked to DAGLA, rs174568, where each point is a barcode (n=8 for Ref, n=9 for Alt). All boxplots shown have a maximum whisker length of 1.5*IQR. The center line represents the median; the box edges represent the upper and lower quartiles. All outliers are shown. FDR-corrected p-values were calculated using MPRAnalyze’s likelihood ratio test indicate significant allele specific activity (p=0.034)

