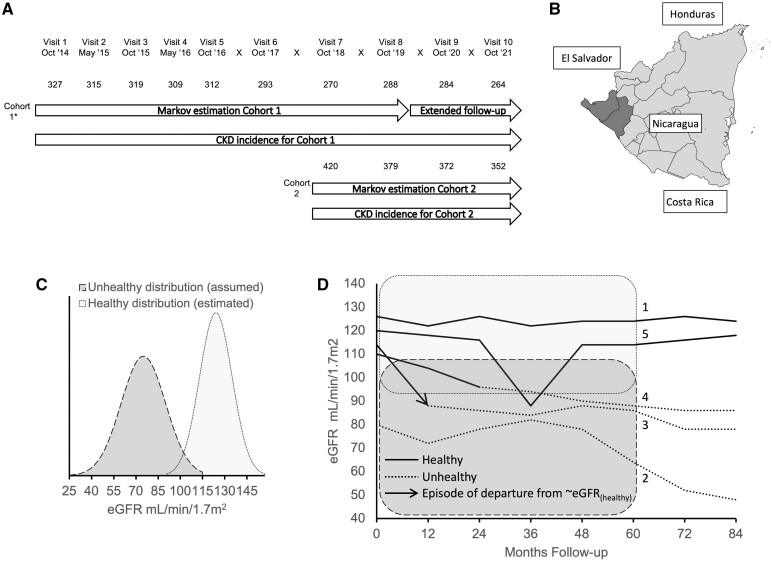
Figure 1.
Outline of study design, location and analysis. (A) Recruitment and study visits over the 7-year follow-up with associated analyses described in this report. Numbers show the number of participants with estimated glomerular filtration rate (eGFR) results at each visit. *24 participants from Cohort 1 were recruited at Visit 2. (B) Leon and Chinandega regions highlighted (dark grey) on a map of Nicaragua. (C) Illustration of eGFR distribution of assumed unhealthy (dark grey) and estimated healthy (light grey) kidney states used in the hidden Markov model. The healthy eGFR distribution was estimated empirically. (D) Illustrative eGFR trajectories superimposed on healthy (light grey) and unhealthy (dark grey) Hidden Markov model distributions. Individuals (labelled 1) might be classified as remaining in a healthy kidney state (solid line) throughout. Other individuals (labelled 2) might be classified as in an unhealthy state (dotted line) at all time points. Individuals (labelled 3) who transition between states might be estimated to have a high probability (i.e. >50%) of transitioning from a healthy to unhealthy state since the previous study visit [marked with the arrowhead and referred to as departure from ∼eGFR(healthy) episode in this study]. It is the probability of this departure from ∼eGFR(healthy) at each study visit that is the outcome used in the time-updated risk-factor analyses in this study. Alternatively, an individual may sustain more gradual decline in eGFR (labelled 4) where they are estimated to have lower probabilities of moving from healthy to unhealthy across several time points [i.e. probabilities of >0% and <50% of a departure from ∼eGFR(healthy) event at multiple time points]. Although no single time point of departure from ∼eGFR(healthy) can be identified, these lower probabilities nonetheless contribute to the time-updated risk-factor analyses in this study. Individuals (labelled 5) with an isolated eGFR measure in the unhealthy distribution may remain classified as healthy throughout or revert to a healthy classification after a number of follow-up visits, as the model makes use of all data points in the follow-up period (see text). Again, the departure from ∼eGFR(healthy) probabilities for these individuals contribute to the risk-factor analyses. Individuals estimated to already be in an unhealthy state do not contribute to the risk-factor analyses (dashed lines), i.e. all observations where the posterior probability of an unhealthy state was >50% at the previous study visit were censored. eGFR measures beyond 60 months were not used for the hidden Markov model to provide insight into the consequences of the estimated Markov states on the medium-term eGFR of participants. eGFR, estimated glomerular filtration rate; departure from ∼eGFR(healthy), departure from the healthy eGFR distribution

