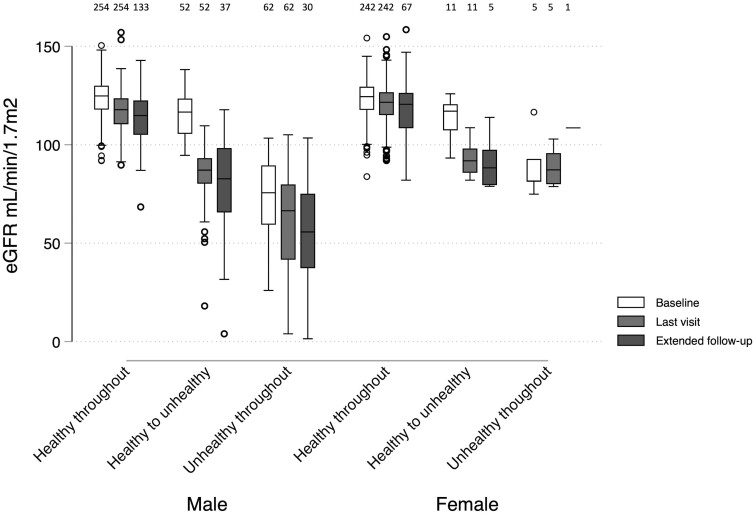
Figure 3.
Estimated glomerular filtration rate distributions in men and women at different time points during follow-up stratified by estimated hidden Markov model state at baseline and last visit. Last visit was the latest attended visit with a hidden Markov model estimate (up to Visit 8 for Cohort 1 or Visit 4 for Cohort 2). Participants who reverted from unhealthy to healthy at any point are excluded from this figure (n = 9). The number of observations in each group is indicated across the top of the figure. Healthy to unhealthy, healthy at baseline and unhealthy at last visit; extended follow-up, latest of Visits 9 and 10 (Cohort 1 only); eGFR, estimated glomerular filtration rate

