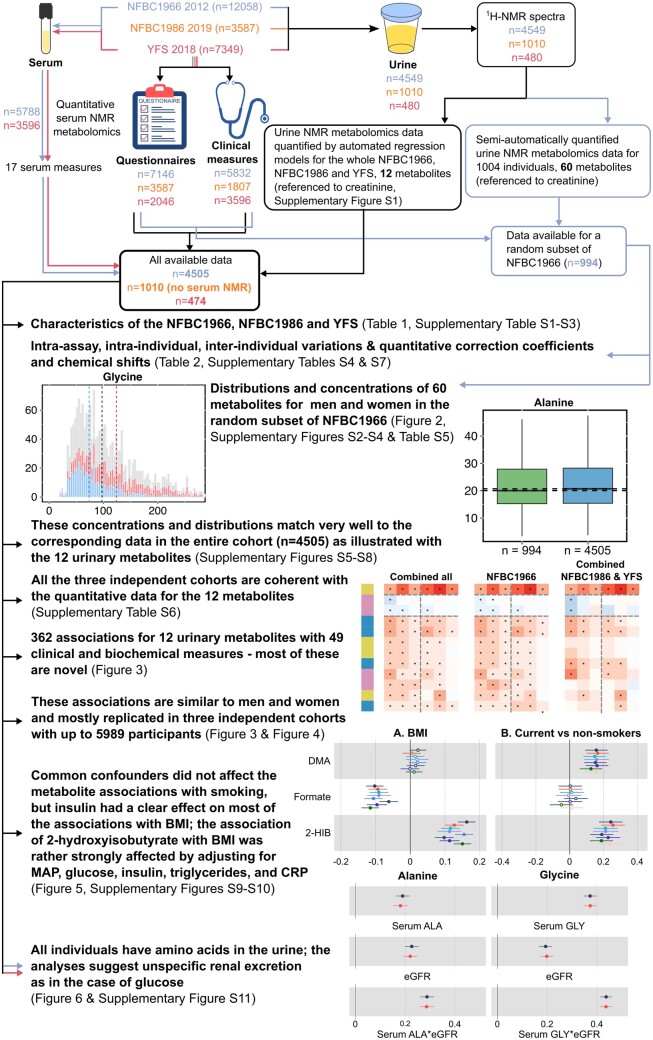
Figure 1.
A flowchart illustrating the study design, statistical analyses and key findings. The data from NFBC1966, NFBC1986 and YFS are indicated by colour-coded arrows: blue, orange and red, respectively. The black arrows represent analyses for all the cohorts. NFBC, Northern Finland Birth Cohort; YFS, Cardiovascular Risk in Young Finns Study; NMR, nuclear magnetic resonance; 1H-NMR, proton nuclear magnetic resonance; BMI, body mass index; MAP, mean arterial pressure; CRP, C-reactive protein; eGFR, estimated glomerular filtration rate

