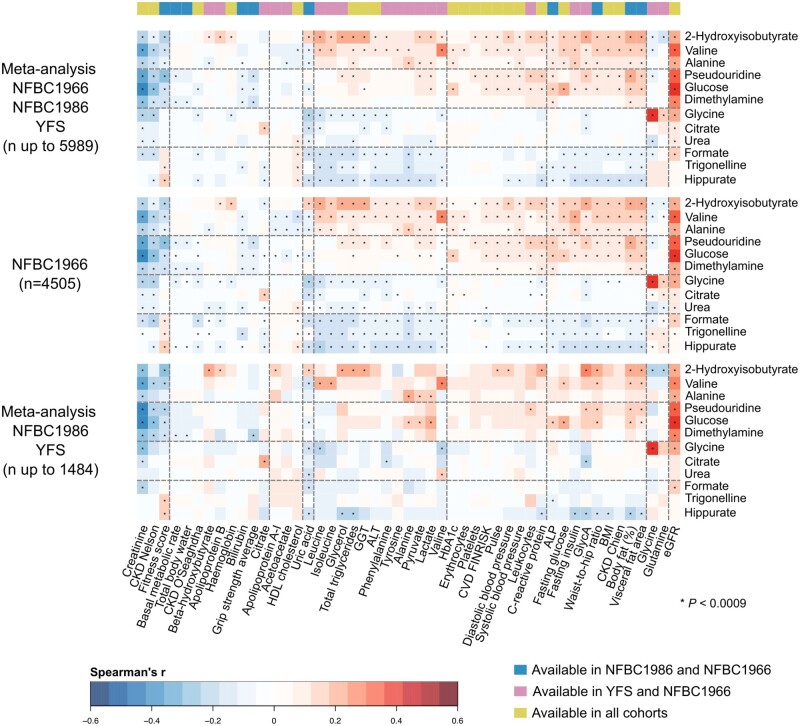
Figure 4.
Meta-analyses of the associations (Spearman’s rank correlations adjusted for sex) between the 12 automatically quantified urinary metabolites (referenced to urinary creatinine) and 49 customary clinical and biochemical measures, to illustrate the replication of the findings in all the three independent population cohorts. The uppermost heat map shows the full meta-analyses for all the available data (n up to 5989). The heat map in the middle is for the entire NFBC1966 (the same heat map as in Figure 3, to facilitate visual comparison). The lowermost heat map shows the meta-analysis for NFBC1986 and YFS (n up to 1484). The heat maps are presented in the same order of metabolites and clusters as in Figure 3. The colour key on the top of the figure represents the availability of clinical and biochemical measures in the three cohorts. There were 20 measures available in all three cohorts (green), 19 measures available only in NFBC1966 and YFS (pink) and 10 measures available only in NFBC1966 and NFBC1986 (blue). P-value <0.0009 is marked with an asterisk in the map to indicate a multiple testing corrected association. ALP, alkaline phosphatase; ALT, alanine aminotransferase; GGT, gamma-glutamyl transferase; eGFR, estimated glomerular filtration rate; CKD, chronic kidney disease; HbA1c, glycated haemoglobin; BMI, body mass index; GlycA, glycoprotein acetyls; FINRISK, a large Finnish population survey of risk factors for chronic, noncommunicable diseases; NFBC, Northern Finland Birth Cohort; YFS, Cardiovascular Risk in Young Finns Study

