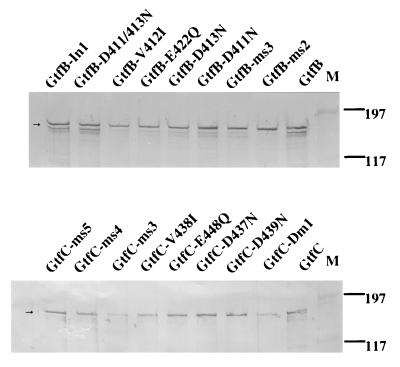
FIG. 4.
Western blot analysis of GtfB and GtfC. The amount of total protein loaded in each lane was the same (20 μg), and the amounts of GtfB and -C were estimated from the band intensities, which were quantified by scanning the blots (duplicate) and subsequently analyzed with the program NIH Image 1.6. Band intensities were comparable between wild-type and individual mutants (except GtfC-Dm1 and GtfC-ms3), and bands of degraded forms could be detected in both wild-type and mutant enzymes. The decreased intensity found for GtfC-Dm1 and GtfC-ms3 was due to the greater tendency of mutated protein to form insoluble fractions in crude lysate. Positions of prestained molecular mass markers (lanes M) are given in kilodaltons. Arrows indicate the predicted molecular weights of the proteins.

