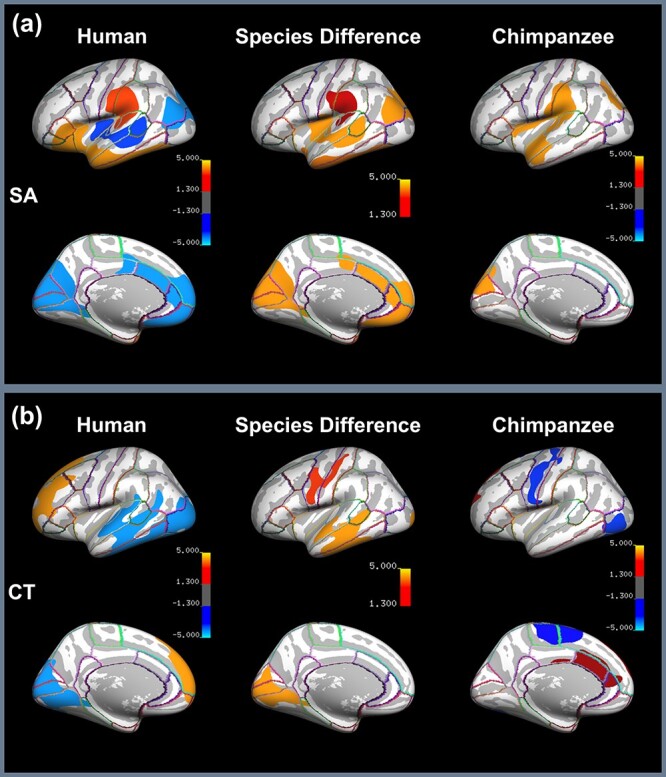
Figure 2 .

Vertex-wise results of (a) SA and (b) CT asymmetry illustrating 1) significant asymmetries for the human (left) and chimpanzee brain (right), in which hot colors refer to leftward asymmetry and cool colors to rightward asymmetry and 2) significant difference of asymmetry between the human and chimpanzee brain (middle), in which the intensity of the hot color indicates the significance level of the difference. The highlighted areas survive the cluster-wise correction for multiple comparisons and the significance level of the respective cluster-forming, and cluster-wise alphas are set as P < 0.01.
