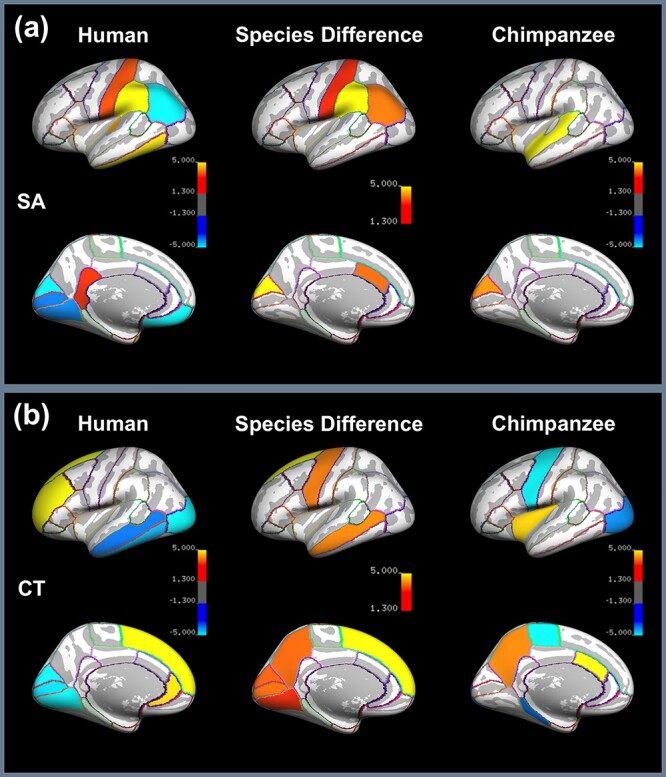
Figure 3 .

SAPS ROI-based results of (a) SA and (b) CT asymmetry illustrating 1) significant signed asymmetries across 34 ROIs for the human (left) and chimpanzee brain (right), in which hot colors refer to leftward asymmetry and cool colors to rightward asymmetry, and 2) differences between species (middle), in which the intensity of the hot color indicates the significance level of the difference. Bonferroni correction has been performed and the significance level is set as P < 0.05/34.
