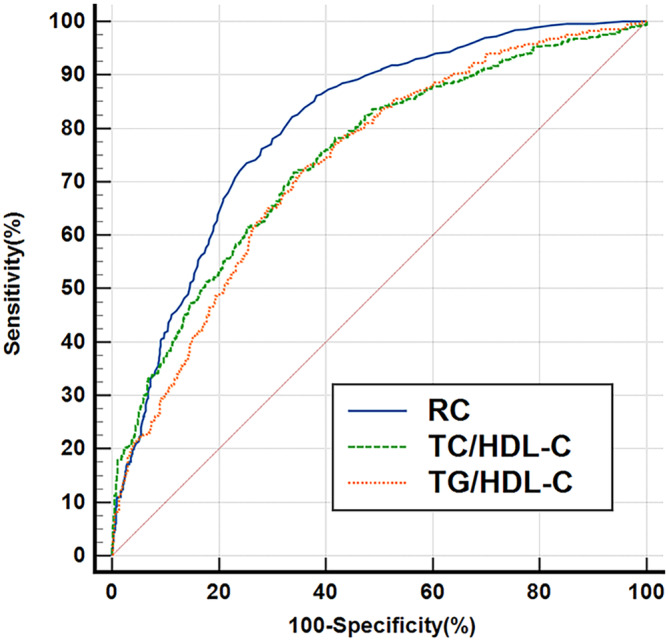
FIGURE 1.

Receiver operating characteristic (ROC) curves of remnant cholesterol (RC), TG/HDL‐C, and TC/HDL‐C. RC had higher predictive value than TG/HDL‐C or TC/HDL‐C (AUC = 0.805, 95% CI: 0.781–0.826, p < .001, cutoff: 0.32, sensitivity: 82.18%, specificity: 66.24%). AUC, area under the curve; HDL‐C, high‐density lipoprotein cholesterol; TC, total cholesterol; TG, triglyceride.
