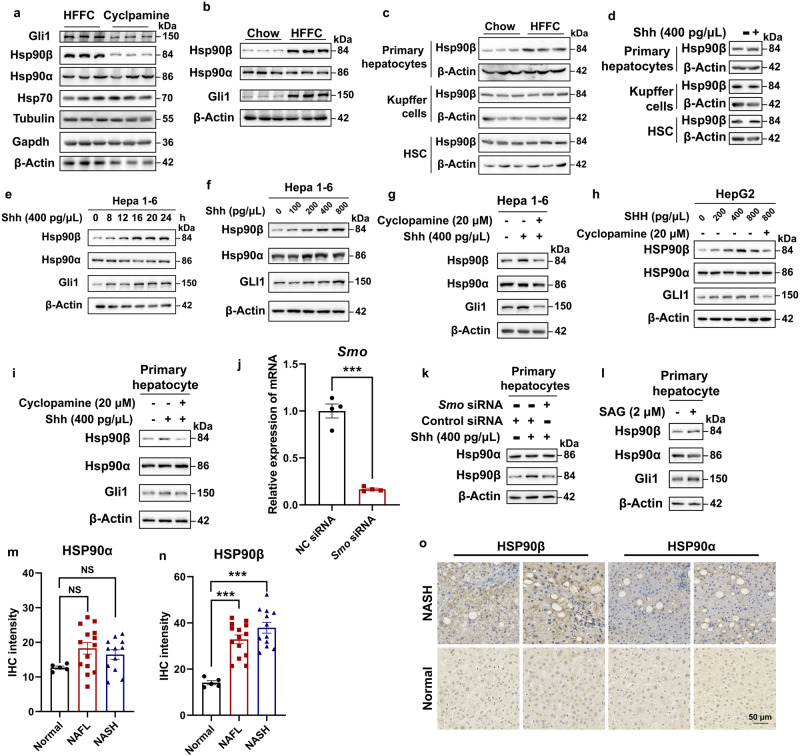
Fig. 2. Shh promotes Hsp90β expression in hepatocytes.
a Western blot analysis of hepatic protein samples from HFFC-diet mice treated with vehicle or cp. b Western blot analysis of hepatic protein samples from mice fed with a normal chow or HFFC diet. c Western blot analysis of primary hepatocyte, Kupffer cells and HSCs from mice fed with chow or HFFC diet. d Western blot analysis of primary hepatocyte treated with vehicle or Shh. Western blot analysis of Hepa 1–6 cells treated with (e) 400 pg/μL Shh for 1–24 h, (f) 0–800 pg/μL Shh for 24 h, or (g) 400 pg/μL Shh with or without 20 μM cyclopamine for 24 h. h Western blot analysis of HepG2 cells treated with 0–800 pg/μL Shh with or without 20 μM cyclopamine for 24 h. i Western blot analysis of primary hepatocytes treated with 400 pg/μL Shh with or without 20 μM cyclopamine for 24 h. j The knockdown efficiency of RNAi targeting Smo assessed by qRT-PCR (n = 4 independent experiments per group; NC siRNA versus Smo siRNA, P = 3.1E-05). Western blot analysis of primary hepatocytes treated with (k) 400 pg/μL Shh after Smo knocked down or (l) 2 μM SAG. The IHC signal intensity of (m) HSP90α (normal versus NAFL, P = 0.083, normal versus NASH, P = 0.29) or (n) HSP90β (normal versus NAFL, P = 4.4E-04, normal versus NASH, P = 1.6E-05) in livers of healthy donors, NAFL and NASH patients. n = 5 participants in normal group. n = 14 participants in NAFL group. n = 12 participants in NASH group. o Representative immunohistochemistry staining of HSP90α or HSP90β in the livers of healthy donors and NASH patients. Data are presented as mean ± SEM. *P < 0.05, **P < 0.01, ***P < 0.001, NS no significant difference, one-way ANOVA. Source data are provided in the Source Data file.

