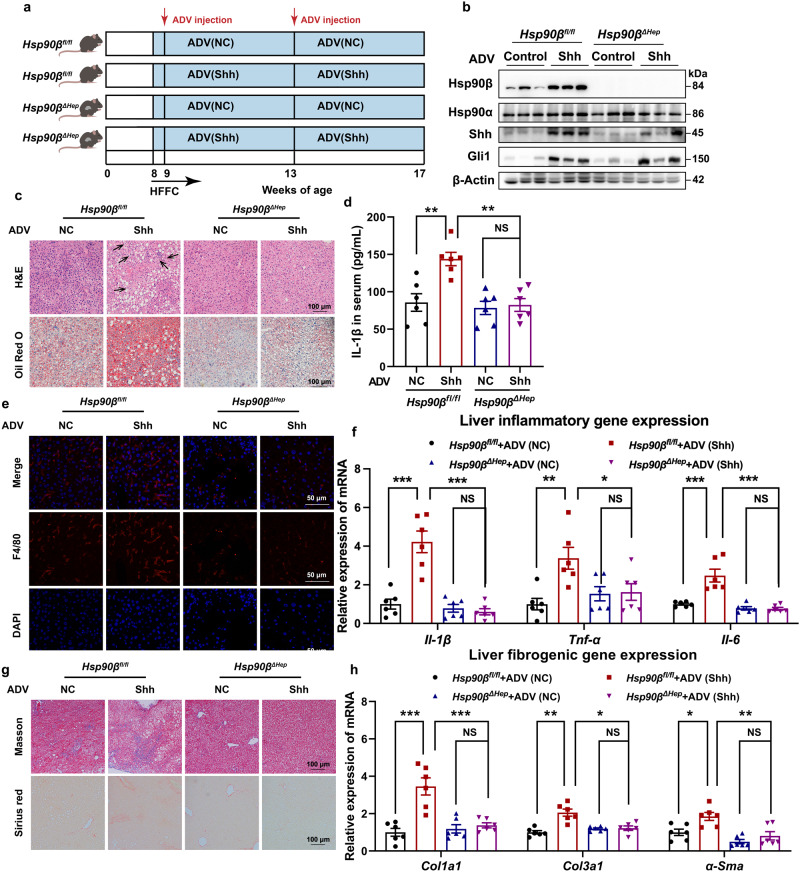
Fig. 3. Hepatic deletion of Hsp90β blocks the facilitation of Shh on the NASH process.
a Experimental scheme of Hsp90βfl/fl or Hsp90βΔHep mice injected with ADV–NC or ADV-Shh on HFFC diet. b Western blot analysis in the liver tissues of Hsp90βfl/fl and Hsp90βΔHep mice injected with ADV–NC or ADV-Shh on HFFC diet (n = 6 mice per group). c Representative H&E-stained FFPE liver sections and ORO-stained frozen liver sections. Each arrow indicated hepatocyte ballooning. d Serum IL-1β levels of Hsp90βfl/fl and Hsp90βΔHep mice injected with ADV–NC or ADV-Shh on HFFC diet (Hsp90βfl/fl–NC versus Hsp90βfl/fl–Shh, P = 0.0018, Hsp90βfl/fl-Shh versus Hsp90βΔHep-Shh, P = 0.0010, Hsp90βΔHep-NC versus Hsp90βΔHep-Shh, P = 0.99). e Representative liver sections stained with F4/80. f The expression of inflammatory genes in livers of Hsp90βfl/fl and Hsp90βΔHep mice injected with ADV–NC or ADV-Shh on HFFC diet (for Il-1β, Hsp90βfl/fl–NC versus Hsp90βfl/fl–Shh, P = 3.6E-06, Hsp90βfl/fl-Shh versus Hsp90βΔHep-Shh, P = 6.7E-07, Hsp90βΔHep-NC versus Hsp90βΔHep-Shh, P = 0.96; for Tnf-α, Hsp90βfl/fl–NC versus Hsp90βfl/fl–Shh, P = 0.0022, Hsp90βfl/fl-Shh versus Hsp90βΔHep-Shh, P = 0.023, Hsp90βΔHep-NC versus Hsp90βΔHep-Shh, P = 0.99; for Il-6, Hsp90βfl/fl–NC versus Hsp90βfl/fl–Shh, P = 2.8E-05, Hsp90βfl/fl-Shh versus Hsp90βΔHep-Shh, P = 3.5E-06, Hsp90βΔHep-NC versus Hsp90βΔHep-Shh, P = 0.99). g Representative liver sections stained with Masson or Sirius red. h The expression of fibrogenic genes in livers of Hsp90βfl/fl and Hsp90βΔHep mice injected with ADV–NC or ADV-Shh on HFFC diet (for Col1a1, Hsp90βfl/fl–NC versus Hsp90βfl/fl–Shh, P = 1.6E-05, Hsp90βfl/fl-Shh versus Hsp90βΔHep-Shh, P = 1.3E-04 Hsp90βΔHep-NC versus Hsp90βΔHep-Shh, P = 0.94; for Col3a1, Hsp90βfl/fl–NC versus Hsp90βfl/fl–Shh, P = 1.8E-05, Hsp90βfl/fl-Shh versus Hsp90βΔHep-Shh, P = 3.1E-04, Hsp90βΔHep-NC versus Hsp90βΔHep-Shh, P = 0.99; for α-Sma, Hsp90βfl/fl–NC versus Hsp90βfl/fl–Shh, P = 0.011, Hsp90βfl/fl-Shh versus Hsp90βΔHep-Shh, P = 0.0023, Hsp90βΔHep-NC versus Hsp90βΔHep-Shh, P = 0.99). Data are presented as mean ± SEM. n = 6 mice per group. *P < 0.05, **P < 0.01, ***P < 0.001, NS no significant difference, one-way ANOVA. Source data are provided in the Source Data file.

